18 - 19 FEBRUARY 1996 - COLD FRONT
by ZAMG
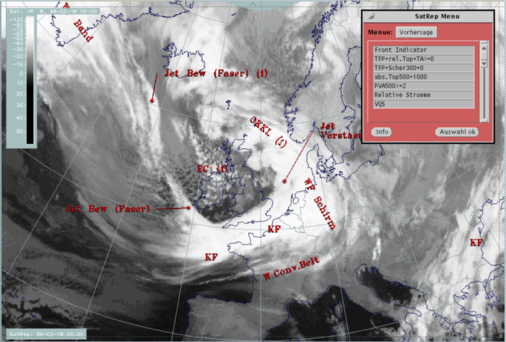
| Front Indicator | This is a line indicating the maximum of the thermal front parameter (TFP) 500/850 hPa (*10-1Km-1) |
|---|---|
| TFP + rel.Top + TA>>=0 | This is a combination of the thermal front parameter (TFP) greater than 3 units, the equivalent thickness (rel.Top) 500/850 hPa (K) and warm advection (TA>=0) (K 12h-1); this combination of key parameters is especially indicative of the thermal characteristic of a Cold Front |
| TFP + Scher300=0 | This is a combination of the thermal front parameter (TFP) 500/850 hPa greater then 3 units and the zero line of shear vorticity at the 300 hPa level (Scher300=0); this combination of key parameters is indicative of the relation between front and jet stream |
| Abs.Top500 + 1000 | This is the combination of height contours at 1000 and 500 hPa (gpm); this combination of key parameters is indicative of the flow and pressure distribution near the surface and in the middle of the troposphere |
| PVA500>=2 | This parameter shows maxima of positive vorticity advection (PVA) at 500 hPa exceeding 2 units (*10-9sec-2); this key parameter indicates areas with increased possibility for more severe weather events because of increased vertical motion (compare Conceptual Models: Wave and Conceptual Models: Front Intensification by Jet Crossing ) |
| Relative Stroeme (relative streams) | This parameter shows relative streams on isentropic surfaces; relative streams are indicative of the different air masses involved in the process and of areas with sinking or rising motion; they can be used to explain cloud configurations requiring special explanation |
| VQS | Gives the location of available vertical cross sections (VQS) |
The Cold Front cloud band under consideration reaches from the Atlantic (approximately 38N/10W) across the English Channel into the North Sea approximately up to the Dutch coast. Cloudiness is rather homogeneous with only slightly lower tops at the rear side of the front.
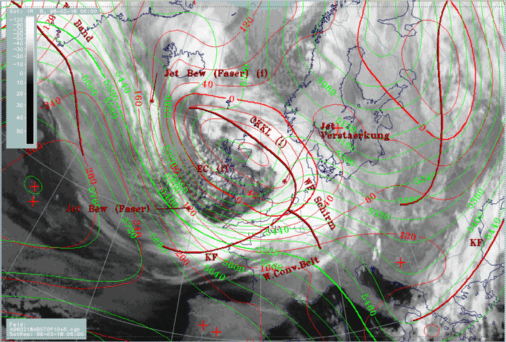
In this case the solid line from the Atlantic across Brittany to the Belgian and Dutch coast, representing the front parameter and indicating the maximum of the TFP (blue lines), is close to the leading edge of the frontal cloud band; consequently the zone with high gradients in the thickness lines (green) can be found within and behind the frontal cloud band. Also the zero line of TA (thick red line) accompanies the leading edge of the frontal cloud band, at least over the land areas, leaving the main cold front cloudiness within CA.
The described appearance of key parameters and their relation to the cloud band is typical for an Ana Cold Front (compare Conceptual Models: Cold Front - Meteorological physical background ) where, because of a back bent Warm Conveyor Belt, the main cloudiness and precipitation events can be found behind the surface Cold Front. This conclusion can be supported by vertical cross sections as well as relative streams.|
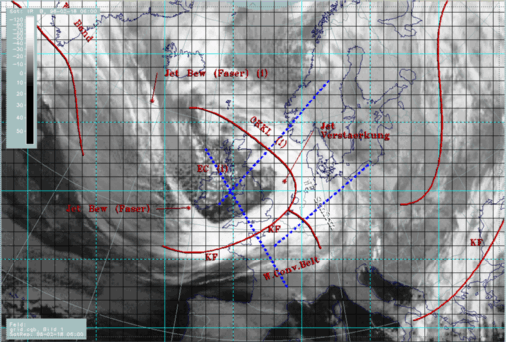
18 February 1996/06.00 UTC - Meteosat IR image; ECMWF grid superimposed, position of vertical cross section indicated
|
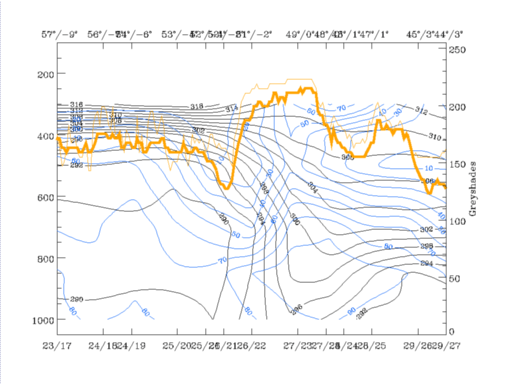
18 February 1996/06.00 UTC - Vertical cross section; black: isentropes (ThetaE), blue: relative humidity, orange thin: IR pixel values,
orange thick: WV pixel values
|
|
|
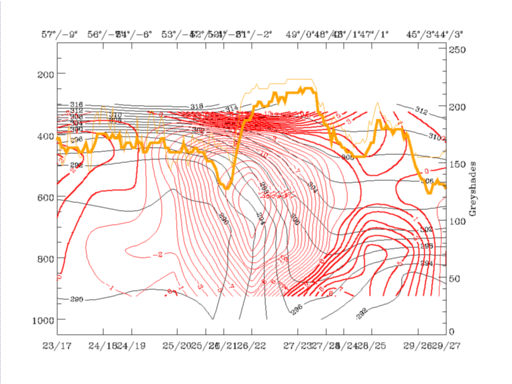
Two isentropic surfaces are selected for computation of relative streams: the lower surface is the Theta = 298K surface which is on top of the main frontal crowding zone and reaches from 400 hPa nearly down to the surface; the second is the Theta = 304K surface which represents the layer between 400 and 600 hPa and is a weak upper level front. On both surfaces relative streams are computed with a system velocity of 305° and 18 m/s. System velocities are determined with the help of cross correlation methods.
|
18 February 1996/06.00 UTC - Meteosat IR image; magenta: relative streams 298K - system velocity 305° 18m/s, yellow: isobars, ECMWF grid
superimposed, position of vertical cross section indicated
|
18 February 1996/06.00 UTC - Meteosat IR image; magenta: relative streams 305K - system velocity 305° 18m/s, yellow: isobars, ECMWF grid
superimposed, position of vertical cross section indicated
|
|
|
- The Warm Conveyor Belt, a relative stream from the region in front of the Cold Front; it originates in the Mediterranean and streams across Spain to west Europe and into the North Sea;
- A relative stream from behind the Cold Front but originating from more humid regions mostly in the north-west; it can be followed from south of Greenland across the Atlantic into the English Channel where it correlates with the cloud band;
- A relative stream from behind the Cold Front but originating from very dry areas mostly in the north and north-east which is often called dry intrusion; in this case it is involved in an already closed circulation over and north-west of the British Isles.
A main difference between the two levels in the region of the Cold Front can be seen in the transition area between the Warm Conveyor Belt and the wet relative stream from behind the Cold Front. In the lower level (298K) relative streams of the Warm Conveyor Belt cross the frontal line (which is approximately north-east of Normandy) and remain on the rear side. There the air rises from about 800 hPa up to about 600 hPa. In the higher level the Warm Conveyor Belt remains in front of and above the surface line. Comparing again with the vertical cross section, this is the humid air that reaches up to 600 hPa, with values of 60% - 90%.
The rest of the Cold Front cloud band is, in both levels, under the influence of the humid relative stream from behind the Cold Front with rising motion from 700 up to 400 hPa. The cloud edge of the Cold Front band is at both levels identical with the transition between the humid and the dry relative stream from the rear side of the Cold Front band. Comparing with the vertical cross section the humid relative stream can be identified with the maximum of more than 50% relative humidity on top of the 304K surface which is around 49N/00E, while the very low values north-west of it (around 52N/02W) indicate the dry intrusion. The whole situation is very typical for an ana front (compare Conceptual Models: Cold Front - Meteorological physical background ).
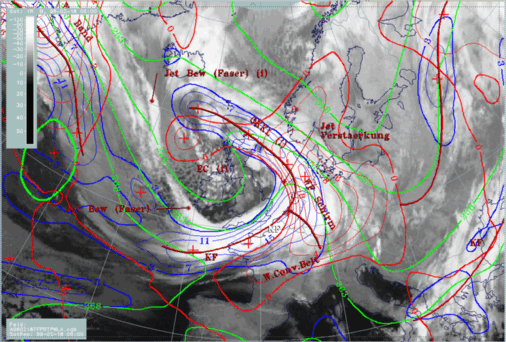
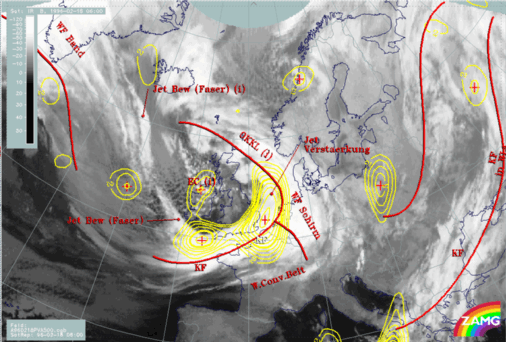
After the evaluation of the thermal characteristics of the Cold Front and of the air masses involved, parameters are discussed which can give some indications about the strength of the connected weather and cloudiness. Maxima of vorticity advection (PVA) superimposed on frontal cloudiness influence weather activity by contributing to upward motion. There are two points of view:
- PVA maxima indicating the approach and/or deepening of troughs; in these cases curvature vorticity is the dominant parameter and the 500 hPa level is a typical height to look at.
- PVA maxima indicating the approach of a jet streak; in these cases shear vorticity is the dominant parameter and the 300 hPa level is a typical height to look at.
|
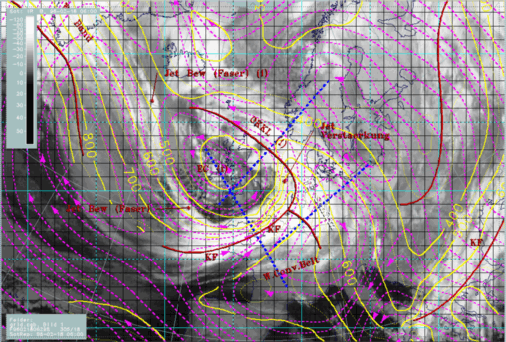
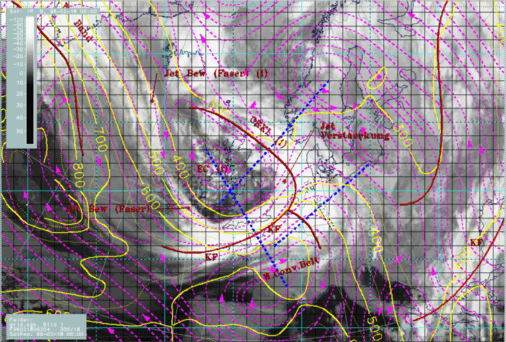
18 February 1996/06.00 UTC - Meteosat IR image; red thick: front indicator, yellow: positive vorticity advection (PVA) 500 hPa
|
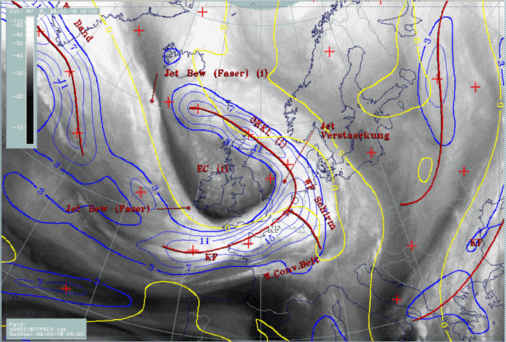
18 February 1996/06.00 UTC - Meteosat WV image; red thick: front indicator, blue: thermal front parameter (TFP) 500/850 hPa, yellow: shear
vorticity 300 hPa
|
|
|
- According to classical definitions this could be the area of the transition from Cold Front to Occlusion (the Occlusion point).
- A PVA maximum at 300 hPa can be expected superimposed on the frontal cloudiness on the left side of the zero line; this leads to a different conceptual model: Intensification of frontal cloudiness by jet streak crossing (sub-menu) and will be investigated there.


