02 - 03 JUNE 2000 - PHYSICAL BACKGROUND ENLIGHTENED WITH HELP OF RELATIVE STREAMS
by ZAMG
|
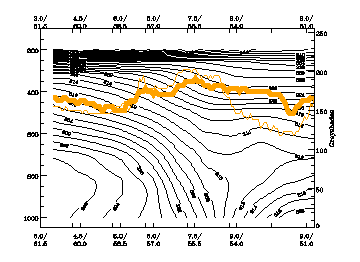
02 June 2000/18.00 UTC - Vertical cross section; black: isentropes (ThetaE), orange thin: IR pixel values, orange thick: WV pixel values
|
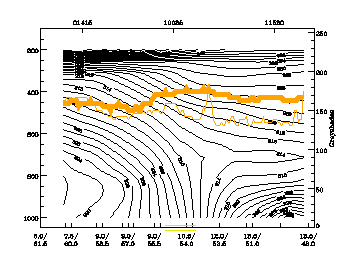
03 June 2000/00.00 UTC - Vertical cross section; black: isentropes (ThetaE), orange thin: IR pixel values, orange thick: WV pixel values
|
|
|
|
|
|
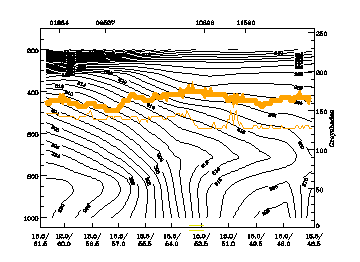
03 June 2000/06.00 UTC - Vertical cross section; black: isentropes (ThetaE), orange thin: IR pixel values, orange thick: WV pixel values
|
Relative streams at low levels
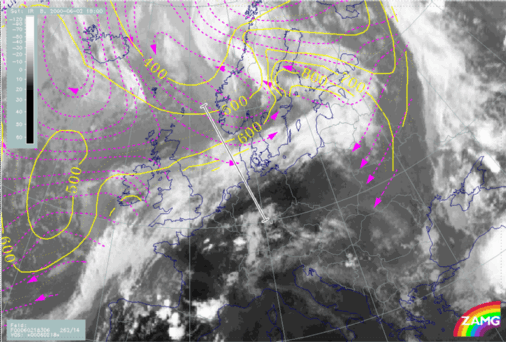
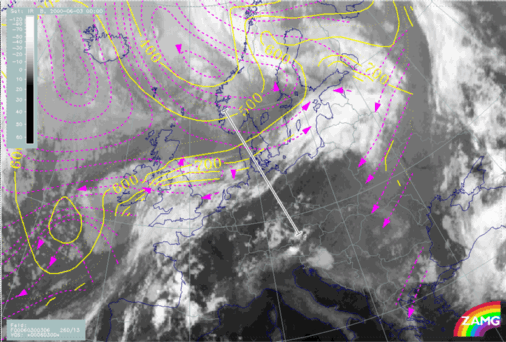
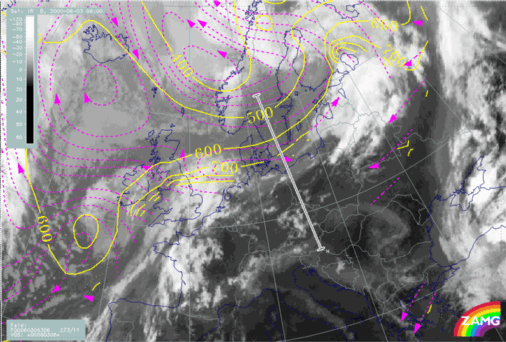
306K is an isentropic surface which represents low levels within the front. The air mass involved with the dry intrusion originates near the centre of the main low. At 02/18.00 UTC a relative stream from behind the front crosses the cloud band at nearly right angles and descends from 550 hPa down to 800 hPa. At 03/00.00 UTC, the angle between the dry intrusion and the frontal cloud band becomes more acute. Air is still sinking from 500 hPa to about 850 hPa. The descent indicated by the relative streams has reached its lowest level. At 03/12.00 UTC the cloud dissipation has reached a mature stage. The Wave upstream, over Great Britain and the North Sea, has developed into a new system with Cold Front and Warm Front, and a relative stream associated with the Warm Front is now dominant. The dry intrusion relative stream has moved to the rear side of the frontal cloud band and has no more relevance for the mechanism of Front Decay.The observed relative flow pattern at low levels support the physical concept of Front Decay very well.
|
02 June 2000/18.00 UTC - Meteosat IR image; magenta: relative streams 306K - system velocity: 262° 14 m/s, yellow: isobars, position of vertical cross
section indicated
|
03 June 2000/00.00 UTC - Meteosat IR image; magenta: relative streams 306K - system velocity: 260° 13 m/s, yellow: isobars, position of vertical cross
section indicated
|
|
|
|
|
|
03 June 2000/06.00 UTC - Meteosat IR image; magenta: relative streams 306K - system velocity: 273° 11 m/s, yellow: isobars, position of vertical cross
section indicated
|
Relative streams at middle levels
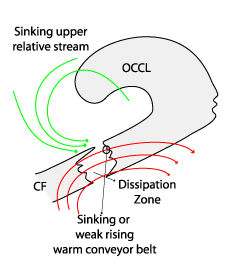
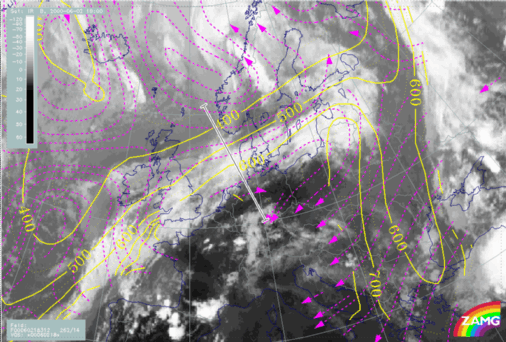
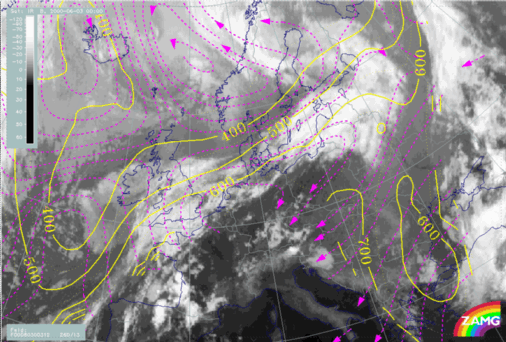
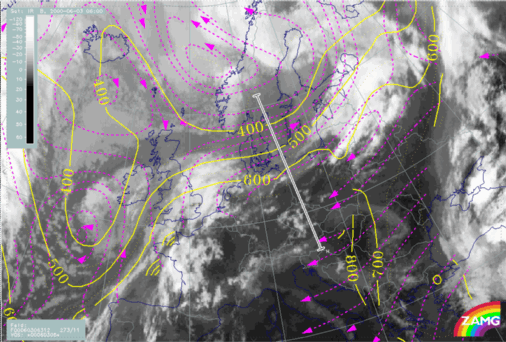
By 18.00 UTC on the 02 June 2000, the isentropic surface of 312K shows a distinctly sinking upper relative stream. The relative stream related to the main low, and responsible for cloud dissipation at lower levels is now situated more to the rear of the frontal cloud band. To the south of the front band the relative streams indicate a sinking Warm Conveyor Belt over Denmark.At 03/00.00 UTC both the upper relative stream and the Warm Conveyor Belt are becoming more pronounced, downward motion from 450 hPa to 650 hPa over the dissolution zone of the Front Decay. At 06.00 UTC the Warm Conveyor Belt is dominating the whole frontal cloud band and reaches far behind the front.
The Warm Conveyor Belt is rising over the area of the Warm Front over Great Britain and the North Sea, as well as over the area of the Cold Front in Warm Advection over the Baltic Sea and the Baltic States. However, the relative stream over the dissipation zone still shows downward motion.
|
02 June 2000/18.00 UTC - Meteosat IR image; magenta: relative streams 312K - system velocity: 262° 14 m/s, yellow: isobars, position of vertical cross
section indicated
|
03 June 2000/00.00 UTC - Meteosat IR image; magenta: relative streams 312K - system velocity: 260° 13 m/s, yellow: isobars, position of vertical cross
section indicated
|
|
|
|
|
|
03 June 2000/06.00 UTC - Meteosat IR image; magenta: relative streams 312K - system velocity: 273° 11 m/s, yellow: isobars, position of vertical cross
section indicated
|
Relative streams at high levels
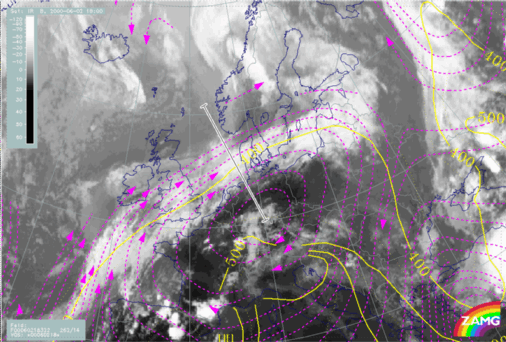
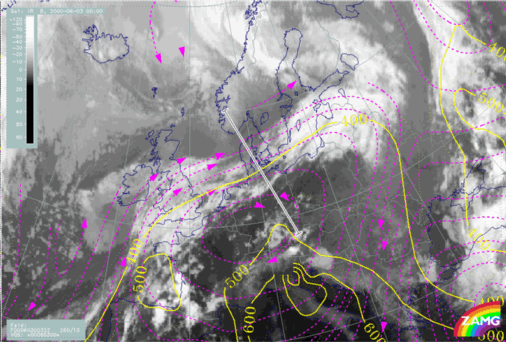
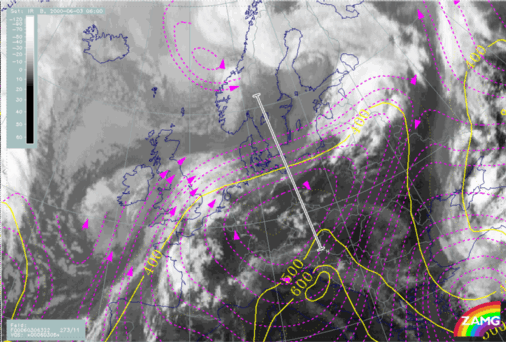
A very weak sinking Warm Conveyor Belt dominates the front at 18.00 UTC.The sinking motion becomes more intense by 03/00.00 UTC associated with the dissipation of the frontal cloud band. At this time, a sinking Warm Conveyor Belt seems to be the driving force for the complete dissolution of the frontal clouds.
At 03/12.00 UTC, the sinking motion over Northern Europe and the Baltic Sea is still well shown by the relative streams of the isentropic surface of 322K.
|
02 June 2000/18.00 UTC - Meteosat IR image; magenta: relative streams 322K - system velocity: 262° 14 m/s, yellow: isobars, position of vertical cross
section indicated
|
03 June 2000/00.00 UTC - Meteosat IR image; magenta: relative streams 322K - system velocity: 260° 13 m/s, yellow: isobars, position of vertical cross
section indicated
|
|
|
|
|
|
03 June 2000/06.00 UTC - Meteosat IR image; magenta: relative streams 322K - system velocity: 273° 11 m/s, yellow: isobars, position of vertical cross
section indicated
|
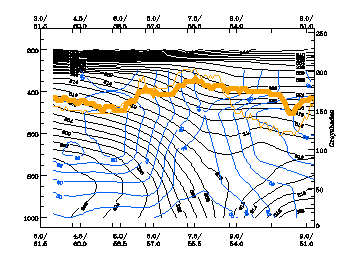
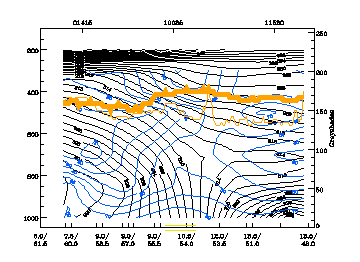
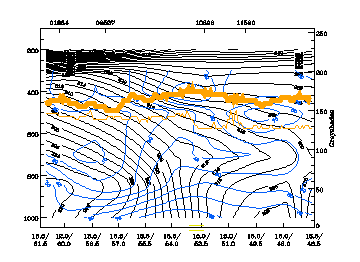
The drying process causing the cloud dissipation can be related to the sinking upper relative streams to the rear of the frontal cloud band. This is well seen in the vertical cross section of relative humidity:
A dry maximum, with 20% relative humidity on 02/18.00 UTC, is positioned to the rear of the frontal cloud band and extends at higher levels during the next 12 hours over the complete frontal gradient zone; This can be associated with lower IR and WV pixel values. This mechanism coincides with the observed reduction in cloudiness at higher levels during the initial stages of Front Decay.
|
02 June 2000/18.00 UTC - Vertical cross section; black: isentropes (ThetaE), blue: relative humidity, orange thin: IR pixel values, orange thick: WV pixel
values
|
03 June 2000/00.00 UTC - Vertical cross section; black: isentropes (ThetaE), blue: relative humidity, orange thin: IR pixel values, orange thick: WV pixel
values
|
|
|
|
|
|
03 June 2000/06.00 UTC - Vertical cross section; black: isentropes (ThetaE), blue: relative humidity, orange thin: IR pixel values, orange thick: WV pixel
values
|


