Split Front - Meteorological Physical Background
by ZAMG and FMI
The initial stage of a Split Front is generally an Ana Cold Front type (see Cold Front - Meteorological physical background ). In contrast to the Ana Cold Front, the Warm Conveyor Belt is overrun aloft by the relative stream of the dry intrusion. This process takes place as the warm air ascends ahead of the surface cold front with a forward component relative to the frontal system.
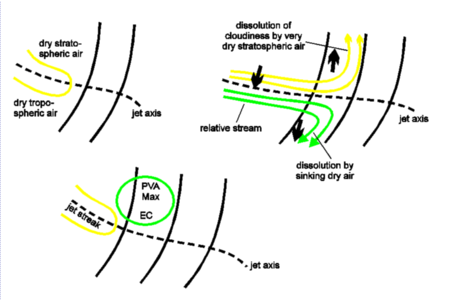
Looking at the situation on isentropic surfaces, the meteorological process which leads to the typical appearance of a Split Front in the satellite images can be explained as follows: together with a jet streak approaching the frontal cloud band, dry stratospheric air is advected on the cyclonic side, and dry tropospheric air on the anticyclonic side of the jet axis. Both air streams are sinking at this stage of development. Relative streams on the isentropic surface are parallel to the jet axis within the jet streak but show a characteristic splitting in the exit region into a northwards oriented and a southwards oriented component. While the southern branch is still sinking, the northern branch is rising again. During an interaction of jet streak and frontal cloud band this configuration of relative streams causes dissolution of cloudiness from above and the Split Front character then appears.
One way to classify the rear edge of the low cloud band is to regard it as a surface front and the rear edge of the high cloud band as an upper level front (see Cloud structure in satellite image). Between these frontal surfaces a shallow moist zone remains (see Weather events). A characteristic feature of the upper level front is that this frontal surface is a moisture boundary and not a thermal boundary (see Typical appearance in vertical cross sections).
Associated with the approaching jet streak, a PVA maximum situated in the left exit region may be superimposed upon the low cloud band of the Split Front. Within this area the development of the above mentioned EC-like cloudiness can often be observed (see Front Intensification By Jet Crossing - Cloud structure in satellite image ).
|
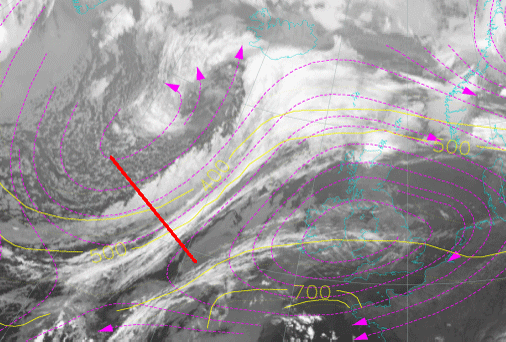
30 August 2005/06.00 UTC - Meteosat 8 IR 10.8 image; magenta: relative streams 318K - system velocity 236°15 m/s, yellow: isobars 318K,
position of vertical cross section indicated
|
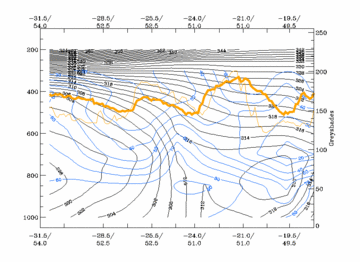
30 August 2005/06.00 UTC - Vertical cross section; black: isentropes (ThetaE), blue: relative humidity, orange
thin: IR pixel values, orange thick: WV pixel values
|
|
|


