Front Intensification By Jet Crossing - Cloud Structure In Satellite Images
by ZAMG
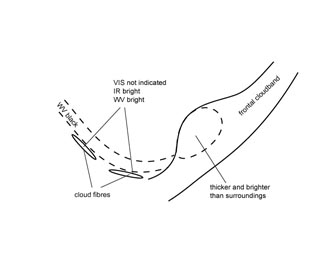
- The satellite image shows an area of increased cloudiness (vertically as well as horizontally) within the frontal cloud band which has superimposed a PVA maximum at 300 hPa (see Key parameters );
- VIS, IR and WV images show bright grey shades, indicating thick cloudiness (see Typical appearance in vertical cross section );
- the increased cloudiness can appear in two forms:
- lumpy structure, which indicates embedded CBs
- Wave-like configuration, as a consequence of formation by cyclonic vorticity;
- this cloud feature is clearly brighter than the surrounding frontal cloudiness (see Key parameters );
- at the rear of the frontal cloud band, WV imagery indicates a jet axis pointing approximately perpendicular to the cloud band by a Black Stripe as well as Cloud Fibres which may be seen also in the IR image.
|
12 August 2005/12.00 UTC - Meteosat 8 IR 10.8 image
|
12 August 2005/12.00 UTC - Meteosat 8 WV 6.2 image
|
|
|
The approaching jet can be seen in IR and WV images as high Cloud Fibres over the Atlantic (from approximately 55N/34W to 51N/17W). In addition, the dark area in the WV image heading towards Ireland indicates dry air on the cyclonic side of the jet axis.
|
24 August 2005/03.00 UTC - Meteosat 8 IR 10.8 image
|
24 August 2005/03.00 UTC - Meteosat 8 WV 6.2 image
|
|
|
The approaching jet can be seen in the IR and WV images by high Cloud Fibres above the Atlantic (from approximately 42N/35W to 48N/27W). In addition darker areas in the WV image can be seen on the cyclonic side of the jet axis which is an indicator of dry air intrusion there.
Appearance in AVHRR imagery
- Images from Channel 1 (fourth row, left) and Channel 2 (fourth row, right) show more details in the cloud structure than in Meteosat VIS, but the cloud patterns do not differ significantly from Meteosat images. Channel 2 images show more contrast between land and sea than Channel 1 or Meteosat images.
- Cloud patterns in images from Channel 4 or Channel 5 (third row, left) are similar to Meteosat IR images, but show more fine structures in the area of Front Intensification (FI) by Jet Crossing.
- RGB-combination of channels (below left, second row) provides a quick overview of cloudiness.
- Channel manipulation (third row, right) highlights cloud patterns, especially the Jet Cloudiness and the Front Intensification.
The image in the third row right shows the result of subtracting: Channel3B from Channel 1. This artificial image is an effective tool for pattern recognition and shows areas with particle size of >= 10µm. The jet fibres (with ice particles >=10µm) are very pronounced.
|
07 February 2000/06.52 UTC - NOAA RGB image (channel 3, 4 and 5)
|
07 February 2000/06.52 UTC - NOAA CH5 image; FI by Jet Crossing at E. Ireland/Irish Sea
|
|
|
|
08 February 2000/14.28 UTC - NOAA RGB image (channel 3, 4 and 5)
|
08 February 2000/14.28 UTC - NOAA RGB image (channel 1, 2 and 4); FI by Jet Crossing at E. Ireland/Irish Sea
|
|
|
|
08 February 2000/14.28 UTC - NOAA CH5 image
|
08 February 2000/14.28 UTC - NOAA CH1 minus CH3B- image
|
|

|
|
08 February 2000/14.28 UTC - NOAA CH1 image
|
08 February 2000/14.28 UTC - NOAA CH2 image; Front Intensification of front crossing over NE Netherlands and
sea area German Bight
|
|
|

