Cumulonimbus Cluster - Key Parameters
by KNMI and DHMZ
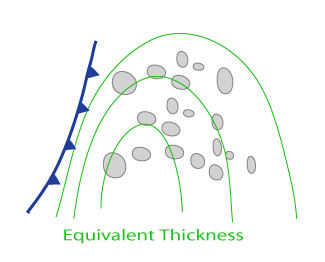
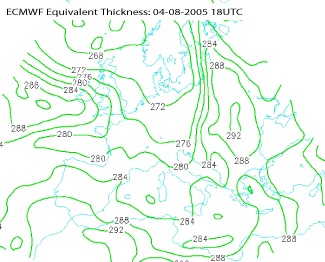
- Equivalent Thickness
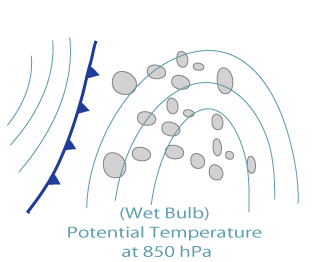
- Potential (Wet Bulb) Temperature at 850 hPa:
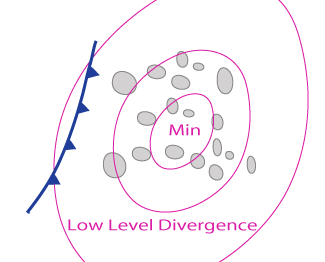
Indication of warm air mass - Low Level Divergence:
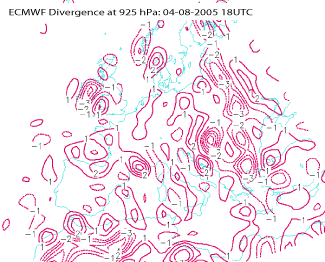
Areas of high convergence are preferable for convective development. - Instability indices:
Boyden index, Showalter index and K index
Equivalent thickness
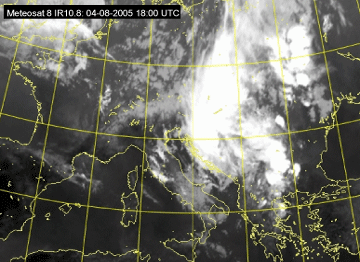
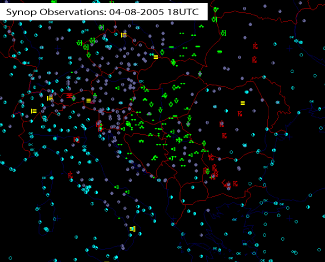
CB Clusters in Warm Air can be found in the large area of South-Eastern Europe, particularly over Bulgaria and Ukraine. They developed, as usually, in the thickness ridge or within a zone of high gradients of equivalent thickness (see Cumulonimbus (Cb) and Mesoscale Convective System (MCS) - Key Parameters ).|
04 August 2005/18.00 UTC - Meteosat 8 IR10.8 image
|
04 August 2005/18.00 UTC - synop observations in the area of interest
|
|
|
|
|
|
Environment favourable for development of convection, equivalent thickness ridge
|
04 August 2005/18.00 UTC - ECMWF model analysis field; green: equivalent thickness
|
Potential Temperature at 850 hPa
CB clusters in Warm Air develop in a tongue of high values of Equipotential or Potential Temperature at lower levels.|
Environment favourable for development of convection, Potential Temperature (ThetaW) at 850 hPa
|
04 August 2005/18.00 UTC - ECMWF model analysis field; cyan: equipotential temperature 850 hPa
|
|

|
Convergence
Areas favourable for development are signified by minimum values of divergence in lower layers due to differential heating and/or orography.|
Environment favourable for development of convection, Low Level Divergence
|
04 August 2005/18.00 UTC - ECMWF model analysis field; magenta: Divergence 925 hPa
|
|
|
Instability Index
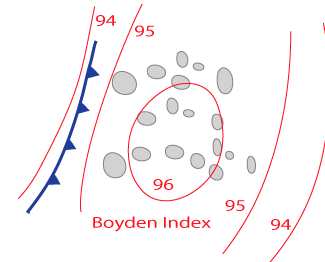
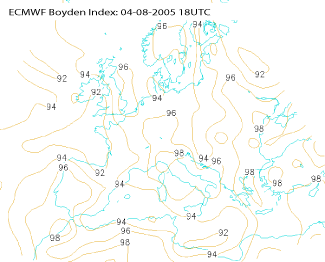
For indication of unstable areas instability indices are used. The most common one, exploited also in this manual is the Showalter Index. The area with high probability of development of thunderstorms is the area with Showalter index values below 3 units. Some other indices, such as K Index or Boyden index can be used. Values of Boyden Index greater than 95 indicate an increased chance of developing thunderstorms.|
Environment favourable for development of convection, Boyden Index
|
04 August 2005/18.00 UTC - ECMWF model analysis field; orange: Boyden Index
|
|
|
Some Supporting Parameters
- Relative humidity at different levels, particularly 700 hPa - existence of moisture is a necessary condition for the formation of clouds
- Warm conveyor belt (see Meteorological Physical Background)
Numerical model parameters in vertical cross section
The importance of the vertical structure of the atmosphere in connection to instability is described in more detail in the next chapter with special attention paid to vertical distribution of:- Isentropes
- Humidity
Different Detection and Observation Methods
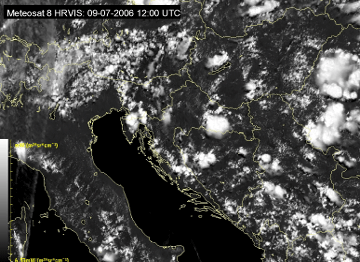
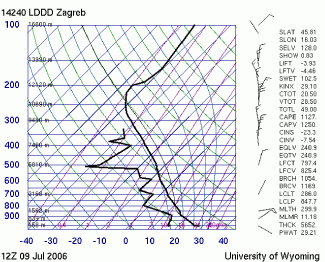
For early detection of convective cells and diagnostics of the behaviour of the forecasting model, different station observations and remote sensing data are used.Radio sounding is a very effective tool to obtain information about the stability of the atmosphere depicting the lapse rate of the temperature and the vertical distribution of moisture.
|
09 July 2006/12.00 UTC - Meteosat 8 HRVIS image
|
09 July 2006/12.00 UTC - Radio sounding Zagreb
|
|
|
|
|
|
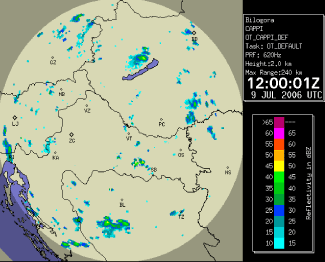
09 July 2006/12.00 UTC - Radar Image
|
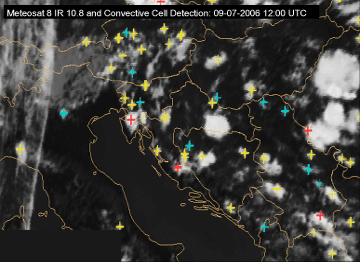
09 July 2006/12.00 UTC - Meteosat 8 IR10.8 image with nowcasting product Convective Cell Detection
|
Furthermore, radar images are essential in diagnosing the strength of a Cb Clusters in terms of precipitation amount and dangerous weather events like wind gusts, heavy hail or downbursts (see "Radar" in Cumulonimbus (Cb) and Mesoscale Convective System (MCS) - Key Parameters ).
On the bases of radar and satellite images more and more nowcasting tools are developed. Nowcasting algorithm used in this investigations (Convective Cells Detection in the image above) detects convective cells on the basis of their top temperature and radius, with three temperature thresholds where blue cross indicates the cell with cloud top temperature lower than -33°C, yellow lower than -42°C and red lower than -50°C.
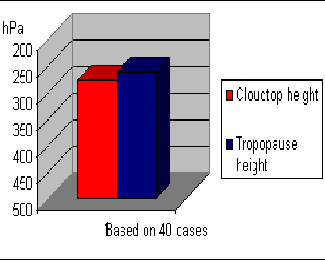
The height of the cloud top is a good indication of the potential activity of the cell. Besides radar derived data, cloud top temperatures can be retrieved from IR images. The estimated top height is computed using the IR temperature and the temperature height profile derived from the nearest available radio sounding. In the diagram shown below, the average cloud top height in the early studies for this manual is 275 hPa (with dispersion about 100 hPa) lying just below the mean value of the tropopause height.
