14 - 15 JUNE 1998 - 15 JUNE/06.00 UTC: FRONTAL DIAGNOSIS
by FMI
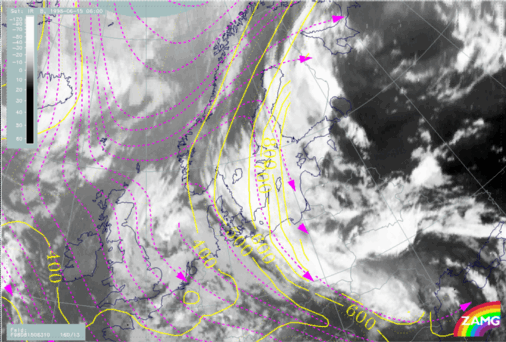
Satellite Overview
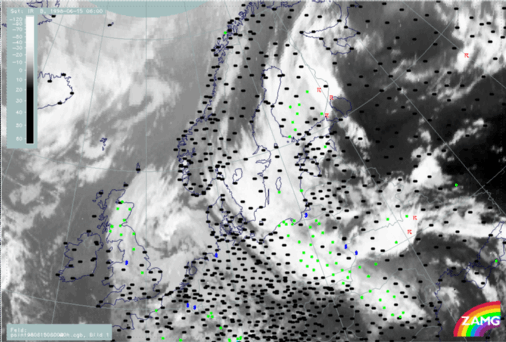
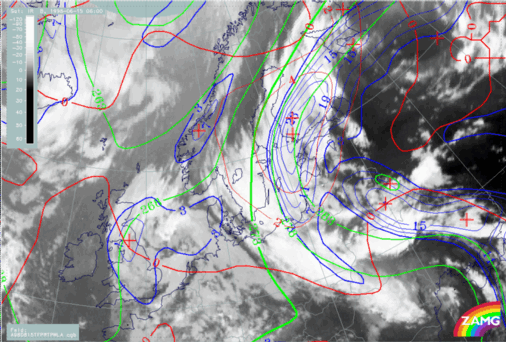
The distinct Warm Front Band over Finland is accompanied by precipitation (Fig. H59). The MCSs over Eastern Finland are accompanied by thunderstorms. The second part of the Warm Front structure from Poland to Sweden is also producing widespread precipitation. The chaotic cloud structures over the Baltic States have no connection with the Cold Front band structure over the Ukraine. The chaotic clouds could be partly explained by the Warm Conveyor bBelt. The former CCB Occlusion still shows some remnants over Romania.
15 June 1998/06.00 UTC - Meteosat IR image; weather events (green: rain and showers, blue: drizzle, cyan: snow, red: thunderstorm with precipitation,
purple: freezing rain, orange: hail, black: no actual precipitation or thunderstorm with precipitation)
Parameters on isobaric surfaces
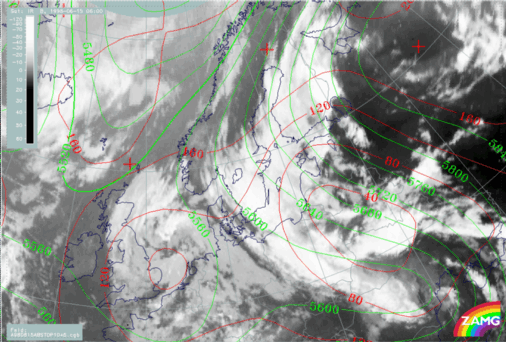
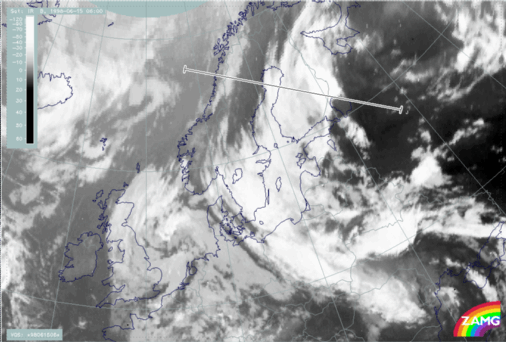
In the WV image (H60), an appearance similar to that of 18.00 and 00.00 UTC can be seen; the broad WV band has moved westward across Sweden to Norway. The separation of tropospheric and stratospheric air at the western edge of the WV band is above 300 hPa. Again there is a displacement between the zero line of shear vorticity and the Dark Stripe in the WV image. Stratospheric air has descended down to 450 hPa in the ULL as well as behind the CF over the Black Sea.
15 June 1998/06.00 UTC - Meteosat WV image; red: height of PV=2 units, black: shear vorticity 300 hPa
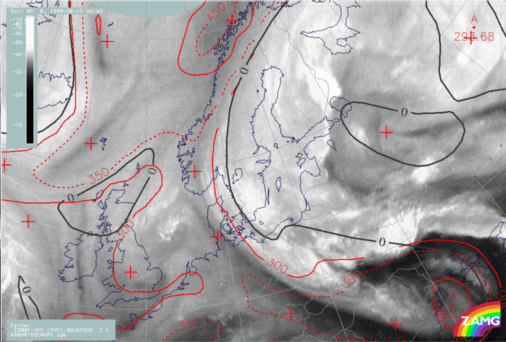
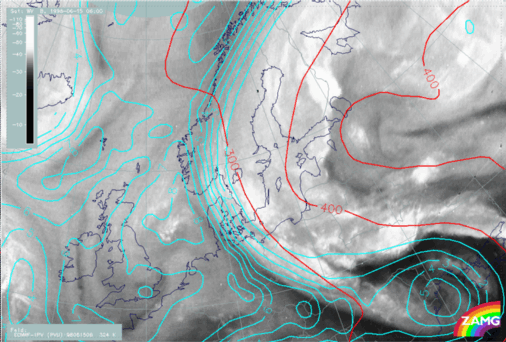
15 June 1998/06.00 UTC - Meteosat IR image; red: height contours 1000 hPa, green: height contours 500 hPa
15 June 1998/06.00 UTC - Meteosat IR image; blue: thermal front parameter (TFP) 500/850 hPa, green: equivalent thickness 500/850 hPa, red: temperature
advection - CA 1000 hPa
Vertical Cross Sections
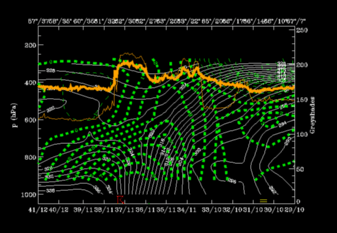
The vertical cross section is drawn perpendicularly to the Warm Front Band over Finland and to the rest of the Baroclinic Boundary over Norway and crosses the Warm Front from east to west (H63).
15 June 1998/06.00 UTC - Meteosat IR image; position of vertical cross section indicated
Temperature advection
The vertical cross section is drawn perpendicularly to the WF band over Finland and to the rest of the Baroclinic Boundary over Norway and crosses the Warm Front from east to west (H63).
15 June 1998/06.00 UTC - Vertical cross section; white: isentropes (ThetaE), green thin: temperature advection - CA, green thick: temperature
advection - WA, orange thin: IR pixel values, orange thick: WV pixel values
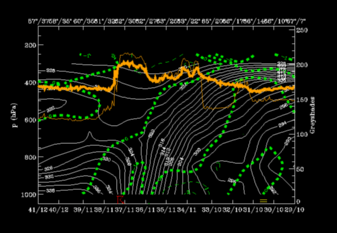
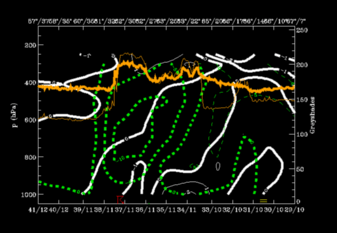
Convergence
The zone of convergence is now more distinctly associated with the Warm Front zone than before; convergence within, divergence below and above (H65).
15 June 1998/06.00 UTC - Vertical cross section; white: isentropes (ThetaE), green thin: divergence, green thick: convergence, orange thin: IR pixel
values, orange thick: WV pixel values
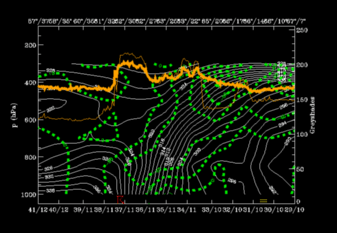
Vertical motion
A well developed circulation cell with convergence seen within the frontal zone, and with upward motion above it (H66); air is sinking below the frontal zone. There is very distinct agreement between upward motion and highest satellite pixel values.
15 June 1998/06.00 UTC - Vertical cross section; white thin: divergence, white thick: convergence, green thick: vertical motion (omega) - upward motion, green
thin: vertical motion (omega) - downward motion, orange thin: IR pixel values, orange thick: WV pixel values
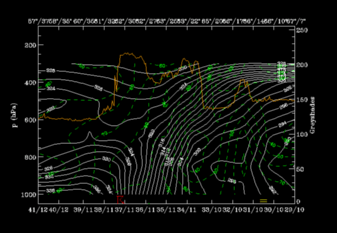
Frontogenetic forcing
High values of frontogenesis are associated with the frontal zone (H67).
15 June 1998/06.00 UTC - Vertical cross section; white: isentropes (ThetaE), green: Q-Vector (normal component), orange thin: IR pixel values, orange thick: WV
pixel values
With help of parameters on isentropic surfaces: Air mass separation
Very typical distribution of humidity can be found: humid zone above the frontal zone, very dry zone below the frontal zone (H68). Selection of characteristic isentropic surfaces (Fig. H54):- 310K: mainly within the frontal zone but more in the lower part;
- 324K lies above the frontal and unstable zones.
15 June 1998/06.00 UTC - Vertical cross section; white: isentropes (ThetaE), green: relative humidity, orange thin: IR pixel values, orange thick: WV
pixel values
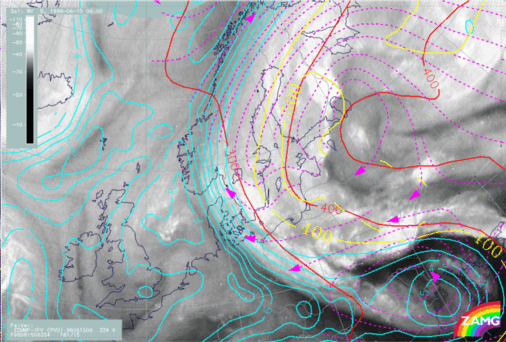
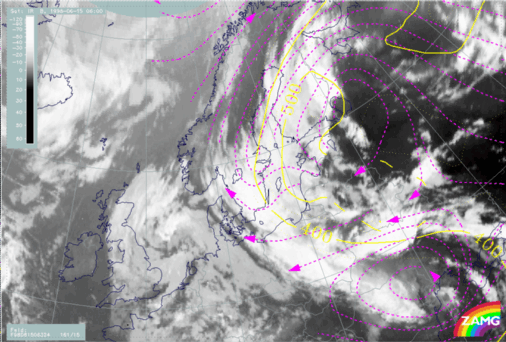
15 June 1998/06.00 UTC - Meteosat IR image; magenta: relative streams 310K, yellow: isobars
15 June 1998/06.00 UTC - Meteosat IR image; magenta: relative streams 324K, yellow: isobars
15 June 1998/06.00 UTC - Meteosat WV image; cyan: height of PV=2 units 324K, red: isobars 324K
15 June 1998/06.00 UTC - Meteosat WV image; cyan: height of PV=2 units 324K dry, red: isobars 324K dry, magenta: height of PV=2 units 324K wet, yellow: isobars
324K wet