15 - 16 MARCH 1998 - 09.00 - 12.00 UTC - FRONTAL DIAGNOSIS - USE OF VERTICAL CROSS SECTIONS

by ZAMG


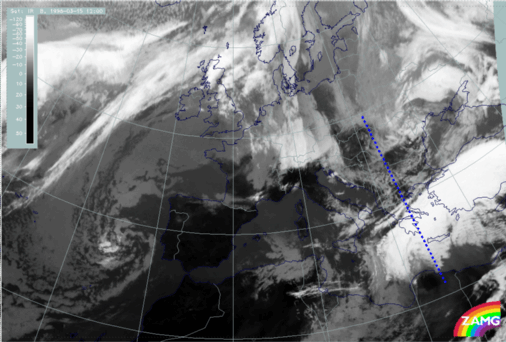
15 March 1998/12.00 UTC - Meteosat IR image; position of vertical cross section indicated
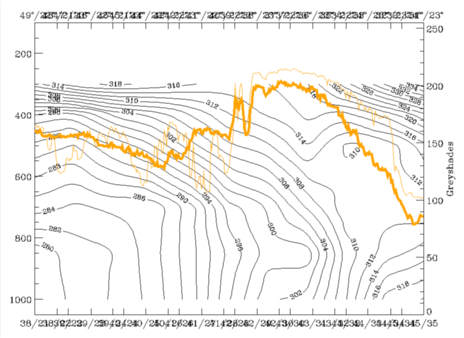
15 March 1998/12.00 UTC - Vertical cross section; black: isentropes (ThetaE), orange thin: IR pixel values, orange thick: WV pixel values
The left image shows the orientation of the vertical cross section line relative to the cloud bands, the right image the relation of isentropic zones and image pixel values in the vertical cross section. The main broad peak of the pixel values between 38N/23E and 36N/23E corresponds to the frontal cloud band in the Mediterranean, while the northern frontal cloud band can be seen only in the single peak around 40N/22E. Isentropes show still two frontal surfaces with surface fronts at 34N/23E and at approximately 39N/23E; both systems show a superadiabatic behaviour of isolines.
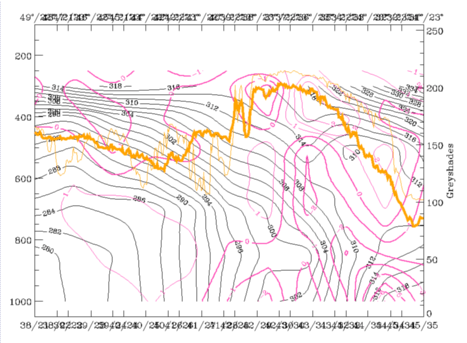
15 March 1998/12.00 UTC - Vertical cross section; black: isentropes (ThetaE), red thin: temperature advection - CA, red thick: temperature advection - WA, orange thin: IR pixel values, orange thick: WV pixel values
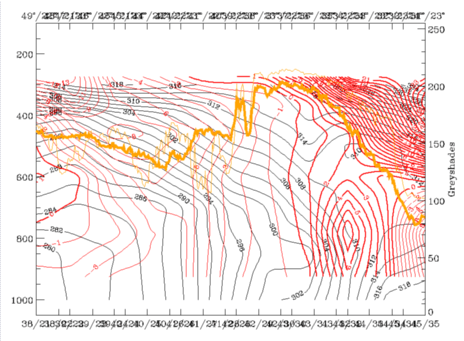
The superimposed TA reflects the approach of cold air as the WA maximum has moved southward in relation to the southern frontal zone; although there is still WA in front of the southern frontal surface, CA is overrunning the frontal surface already in the middle troposphere (above 600 hPa); the northern system is still completely under the influence of CA.
15 March 1998/12.00 UTC - Vertical cross section; black: isentropes (ThetaE), magenta thin: divergence, magenta thick: convergence, orange thin: IR pixel values, orange thick: WV pixel values
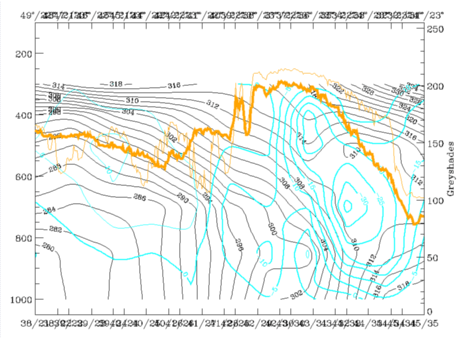
15 March 1998/12.00 UTC - Vertical cross section; black: isentropes (ThetaE), cyan thick: vertical motion (omega) - upward motion, cyan thin: vertical motion (omega) - downward motion, orange thin: IR pixel values, orange thick: WV pixel values
The intensity of the frontal circulation cell is presented in the figures above with help of divergence (left image) and vertical motion (right image). The southern frontal zone is still very active with convergence up to 600 - 500 hPa and intensive upward motion. But a new interesting phenomenon has happened with the northern Cold Front in Cold Advection: the development of convergence in low layers (up to 800 hPa) accompanied by upward motion from the surface to 600 hPa (around 40N/22E). This fact might be a sign that although the frontal zone is not accompanied by extended cloudiness and although it seems to be inactive, there is still some inherent possibility of development.

SUB-MENU OF 15 - 16 MARCH 1998
09.00 - 12.00 UTC - KEY PARAMETERS ON ISOBARIC SURFACE
09.00 - 12.00 UTC - FRONTAL DIAGNOSIS - RELATIVE STREAMS AND CONVEYOR BELTS