12 - 13 NOVEMBER 1997 - THE PERIOD 12 NOVEMBER 14.00 - 18.30 UTC
by ZAMG
Observational part
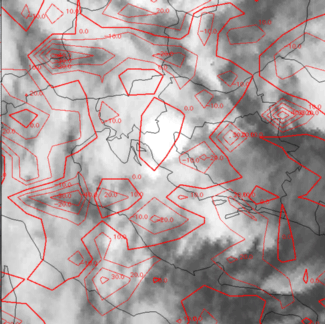
The period under consideration concentrates on some developments in the area north Adriatic Sea - Croatia - Bosnia - Slovenia which is the thunderstrom complex Th3 from the subperiod before. There are two separate periods with only half hourly time intervals; a fact which has to be taken into account if deviation values or lightning measurements are compared to the other periods based on one hourly intervals.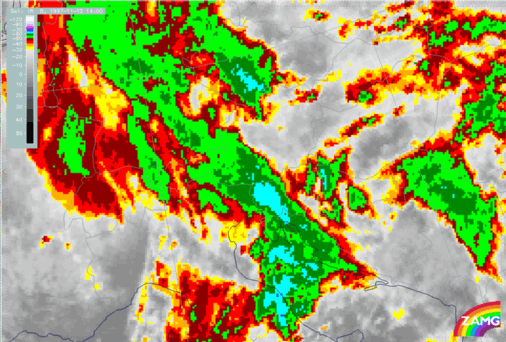
A second area of interest is the bluish elongated area from south Austria across Slovenia to some parts of Croatia. This is the system Th1 which has been detected in the period 06.00 - 12.00 UTC within the frontal cloud band over north Italy.
A third area can be noticed over the Adriatic Sea around approximately 44N/14E reaching from the Italian to the Croatian coast areas. It has been discussed as a strongly developing MCS Th3 over Italy during the period 09.00 - 12.00 UTC; it will become the most interesting feature for this period.
|
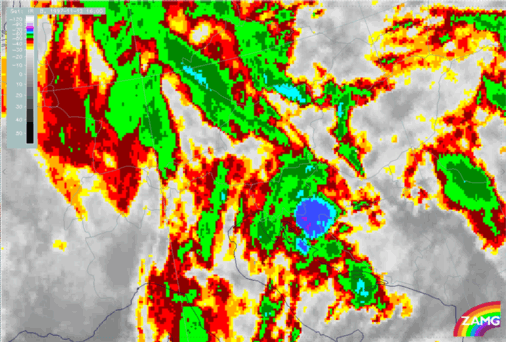
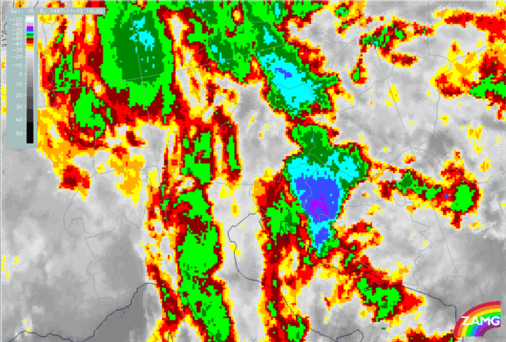
12 November 1997/14.30 UTC - Meteosat IR enhanced image
|
12 November 1997/15.00 UTC - Meteosat IR enhanced image
|
|
|
|
|
|
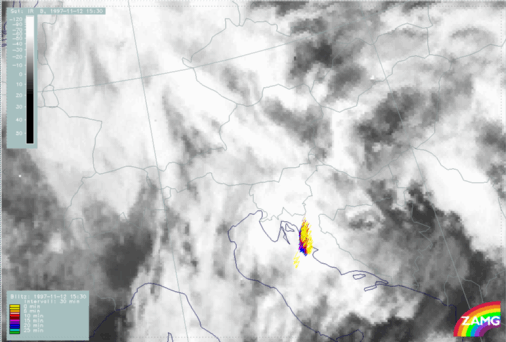
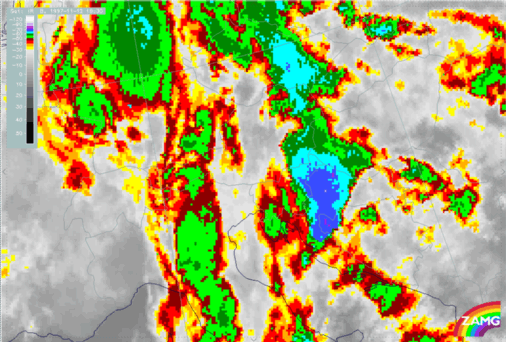
12 November 1997/15.30 UTC - Meteosat IR enhanced image
|
12 November 1997/16.00 UTC - Meteosat IR enhanced image
|
|
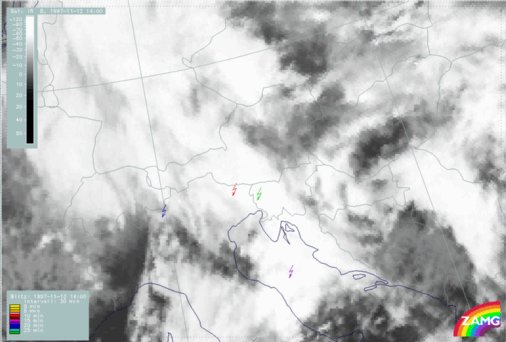
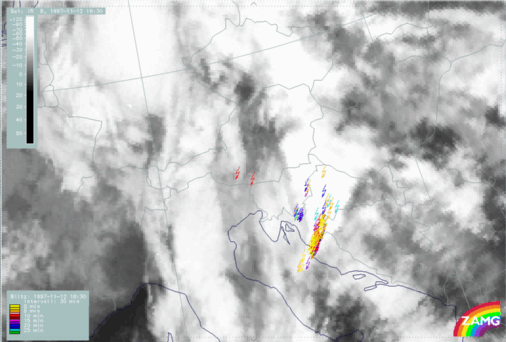
12 November 1997/14.00 UTC - Meteosat IR image; lightning reports
|
12 November 1997/14.30 UTC - Meteosat IR image; lightning reports
|
|
|
|
|
|
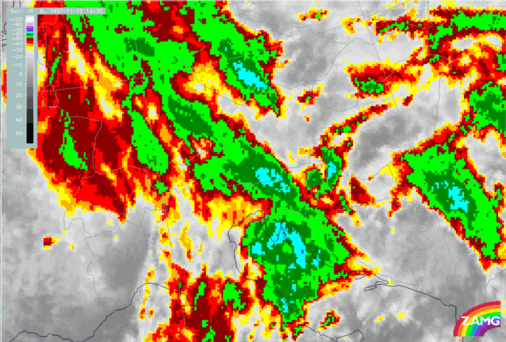
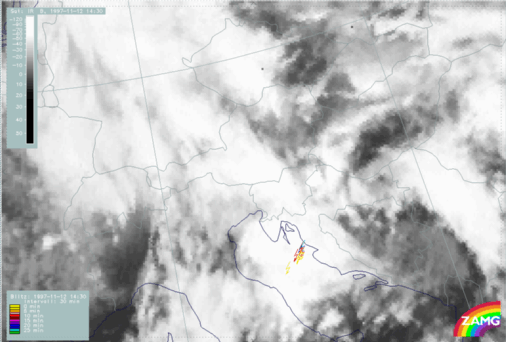
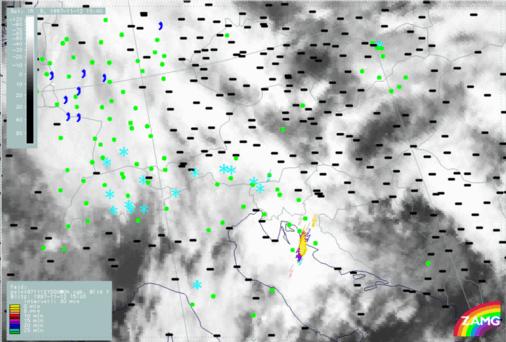
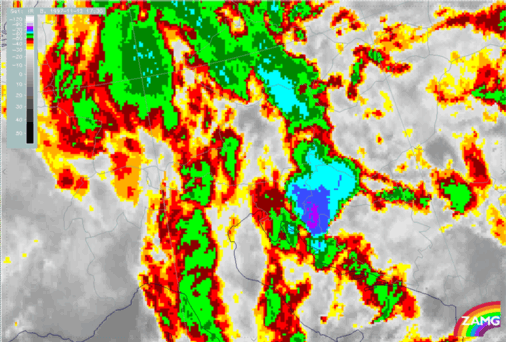
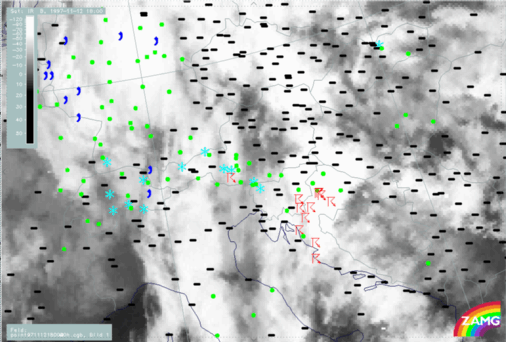
12 November 1997/15.00 UTC - Meteosat IR image; weather reports (green: rain and showers, blue: drizzle, cyan: snow, purple: freezing rain, red:
thunderstorm with precipitation, orange: hail, black: no actual precipitation or thunderstorm with precipitation)
|
12 November 1997/15.30 UTC - Meteosat IR image; lightning reports
|
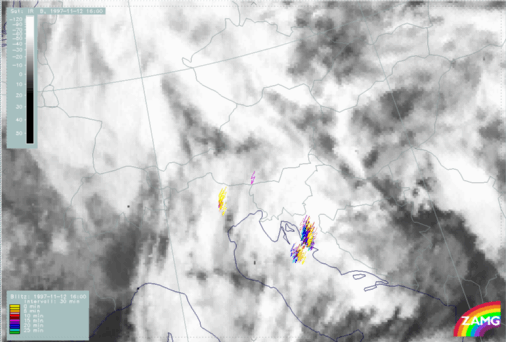
For the 14.00 UTC image (left image top) not too many lightning observations took place during the last half hour and the centre of main activity is the huge frontal cloud cell over north-east Italy and Slovenia. This changes dramatically during the next half hour till 14.30 UTC (right image top) where a lot of lightning over the Adriatic Sea is observed exactly where the development of the colder tops of the sub-cell takes place. The same can be noticed for 15.00 UTC (left image middle) and even more intensively for 15.30 (right image middle) where the yellow, actual lightning is observed over the Croatian coast. During the next half hour till 16.00 UTC (left image bottom) the lightning reports remain approximately in the same area and do not move with the coldest tops into the north, north-eastern parts of Croatia. So the lightning remains at the upstream part of this cellular substructure.
|
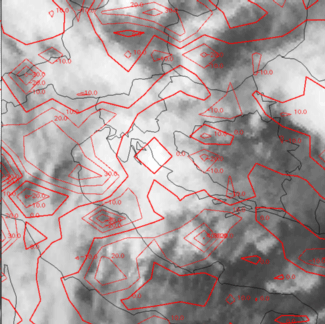
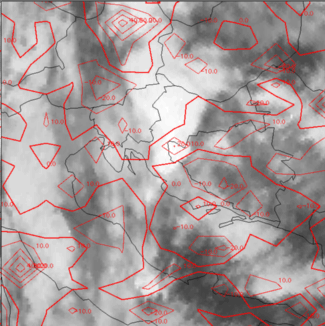
12 November 1997/15.00 UTC - Meteosat IR image; red: mean values of grey shades of cloud development and decay
|
12 November 1997/15.30 UTC - Meteosat IR image; red: mean values of grey shades of cloud development and decay
|
|
|
|
|
|
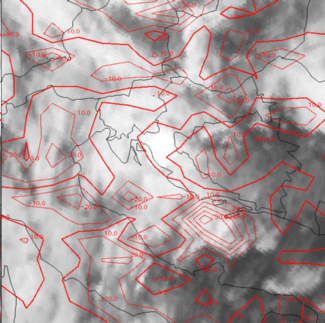
12 November 1997/16.00 UTC - Meteosat IR image; red: mean values of grey shades of cloud development and decay
|
The next two half hour periods are shown in the second image (right image top) and in the third image (left image bottom). The same results can be derived: there is mostly weak decay of cloudiness in the area of the MCS except for a small positive area in agreement with the local scale sub-cell.
|
12 November 1997/15.30 - 16.00 UTC - Meteosat IR development image
|
12 November 1997/15.00 - 16.00 UTC - Meteosat IR development image
|
|
|
|
12 November 1997/17.30 UTC - Meteosat IR enhanced image
|
12 November 1997/18.00 UTC - Meteosat IR enhanced image
|
|
|
|
|
|
12 November 1997/18.30 UTC - Meteosat IR enhanced image
|
|
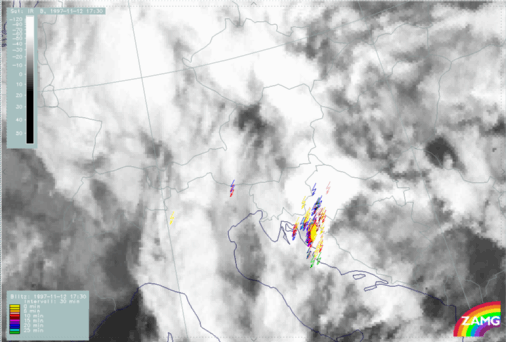
12 November 1997/17.30 UTC - Meteosat IR image; lightning reports
|
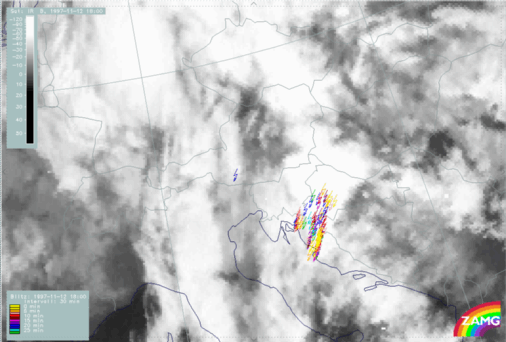
12 November 1997/18.00 UTC - Meteosat IR image; lightning reports
|
|
|
|
|
|
12 November 1997/18.30 UTC - Meteosat IR image; lightning reports
|
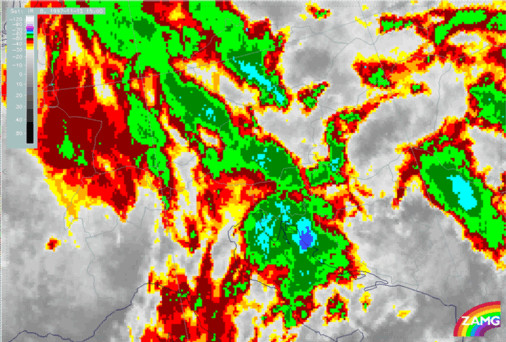
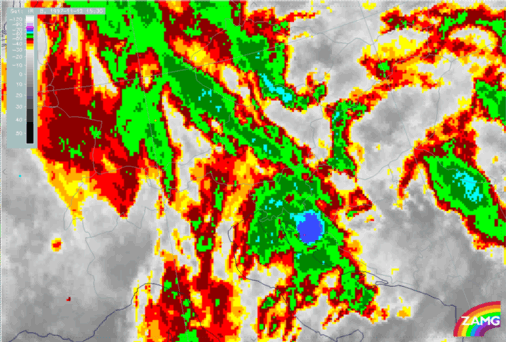
12 November 1997/18.00 UTC - Meteosat IR image; weather reports (green: rain and showers, blue: drizzle, cyan: snow, purple: freezing rain, red:
thunderstorm with precipitation, orange: hail, black: no actual precipitation or thunderstorm with precipitation)
|
Synoptic environment part
|
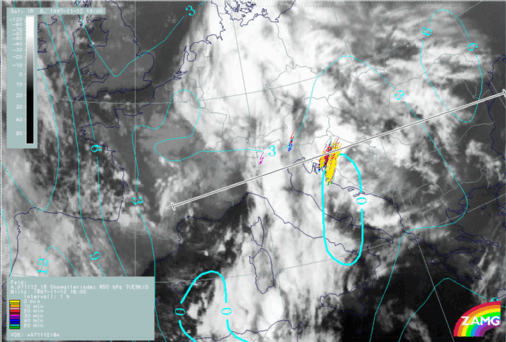
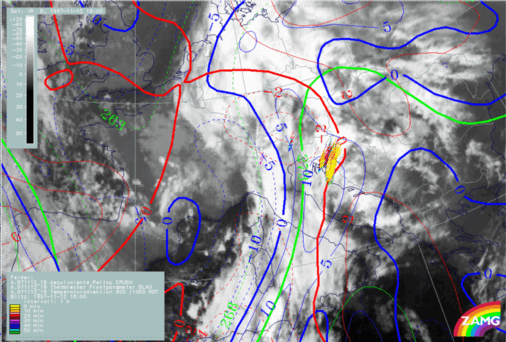
12 November 1997/18.00 UTC - Meteosat IR image; blue: thermal front parameter (TFP) 500/850 hPa, green: equivalent thickness 500/850 hPa, red:
temperature advection 1000 hPa, lightning reports
|
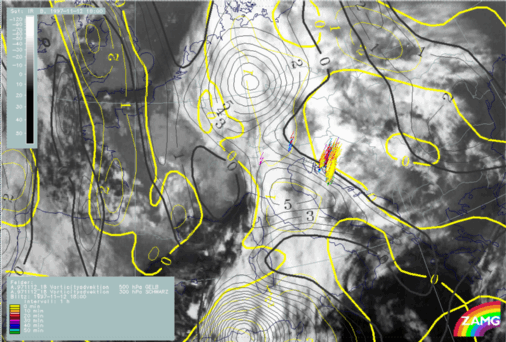
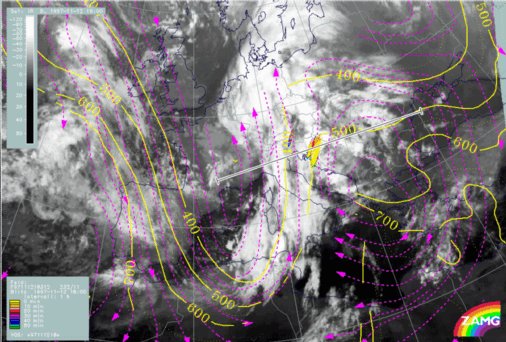
12 November 1997/18.00 UTC - Meteosat IR image; yellow: positive vorticity advection (PVA) 500 hPa, black: positive vorticity advection (PVA) 300 hPa,
lightning reports
|
|
|
|
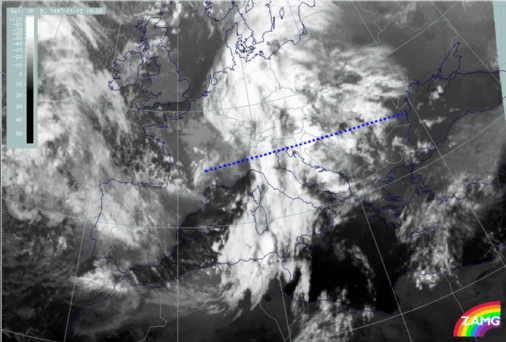
12 November 1997/18.00 UTC - Meteosat IR image; position of vertical cross section indicated
|
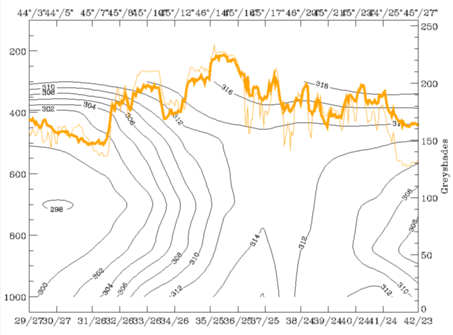
12 November 1997/18.00 UTC - Vertical cross section; black: isentropes (ThetaE), orange thin: IR pixel values, orange thick: WV pixel values
|
|
|
|
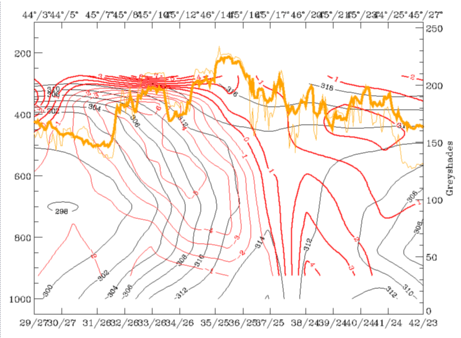
12 November 1997/18.00 UTC - Vertical cross section; black: isentropes (ThetaE), red thin: temperature advection - CA, red thick: temperature
advection - WA, orange thin: IR pixel values, orange thick: WV pixel values
|
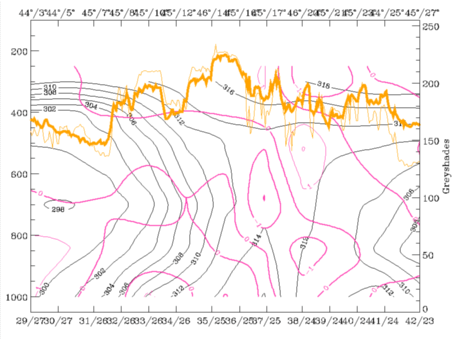
12 November 1997/18.00 UTC - Vertical cross section; black: isentropes (ThetaE), magenta thin: divergence, magenta thick: convergence, orange
thin: IR pixel values, orange thick: WV pixel values
|
|
|
|
|
|
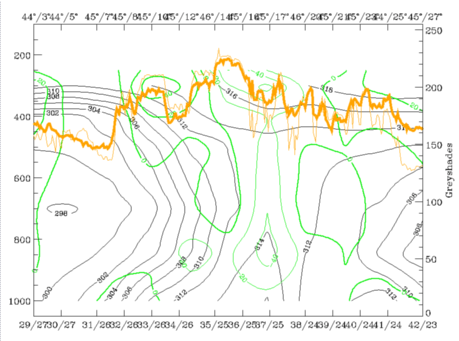
12 November 1997/18.00 UTC - Vertical cross section; black: isentropes (ThetaE), green thick: vorticity advection - PVA, green thin: vorticity
advection - NVA, orange thin: IR pixel values, orange thick: WV pixel values
|
- Superadiabatic frontal layer below 700 hPa;
- MCS at frontal surface;
- Deep layer of CA connected with cold front surface (left image top); if at all WA only in very low layers; this is different from all the other convective cells described till now where there was WA, at least in a low to middle layer;
- Although convergence (right image top) is rather weak in the area of the thunderstorm reports there is notable convergence in front of the frontal surface over approximately 45N/17E over east Croatia; a thick pre-frontal convergence layer was one feature common to the thunderstorm cells discussed so far;
- Increase of PVA with height (left image bottom) is connected with the western maxima of satellite signals and has nothing to do with the MCS Th3 under consideration.

- ThetaE 312K is on top of the frontal surface and can be followed in the area of the frontal convective feature Th3 down to 500 hPa;
- ThetaE 314K is an undisturbed surface immediately above and indicates a layer between 300 and 450 hPa.
|
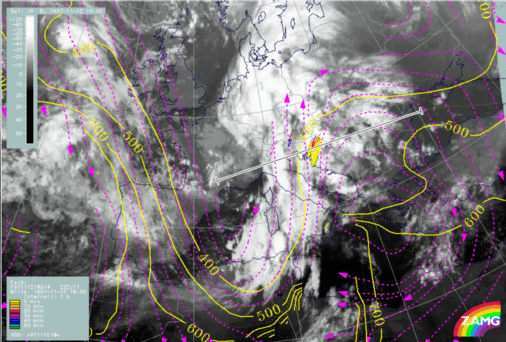
12 November 1997/18.00 UTC - Meteosat IR image; magenta: relative streams 312K - system velocity 232° 11 m/s, yellow: isobars, lighting
reports; position of vertical cross section indicated
|
12 November 1997/18.00 UTC - Meteosat IR image; magenta: relative streams 314K - system velocity 232° 11 m/s, yellow: isobars, lighting
reports; position of vertical cross section indicated
|
|
|


