17 APRIL 1996 - CYCLOGENESIS IN THE WESTERN MEDITERRANEAN: FORECAST FOR "SPECIAL INVESTIGATION" 17 APRIL 12.00 UTC TO 18.00 UTC
by ZAMG
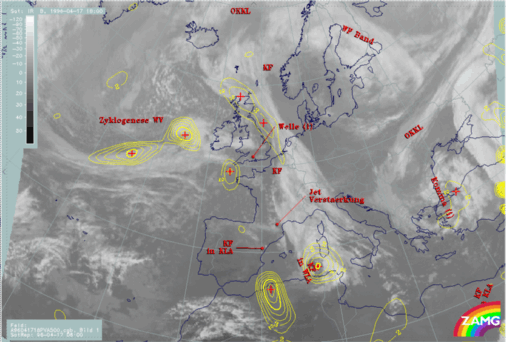
- A Jet Intensification which is accompanied by intensified cloudiness over France.
- Frontal cloud bands which are in a state of re-shaping under the influence of cyclogenesis in the western Mediterranean.
|
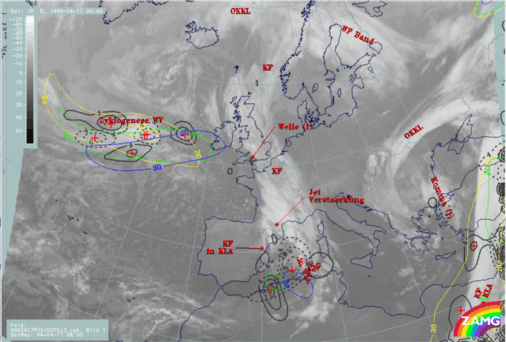
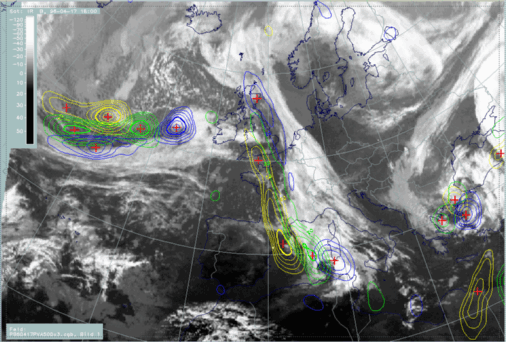
17 April 1996/06.00 UTC - Meteosat IR image; yellow: positive vorticity advection (PVA) 500 hPa 06.00 UTC, green: positive vorticity advection
(PVA) 500 hPa 12.00 UTC, blue: positive vorticity advection (PVA) 500 hPa 18.00 UTC; SatRep overlay: names of conceptual models
|
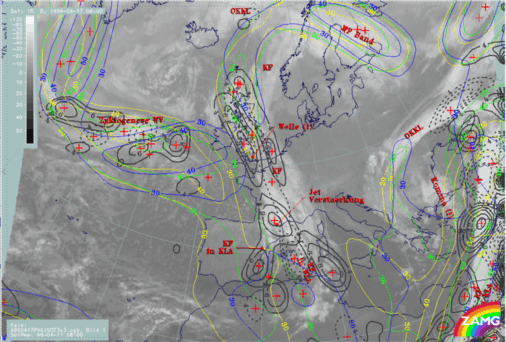
17 April 1996/06.00 UTC - Meteosat IR image; yellow: positive vorticity advection (PVA) 300 hPa 06.00 UTC, green: positive vorticity advection
(PVA) 300 hPa 12.00 UTC, blue: positive vorticity advection (PVA) 300 hPa 18.00 UTC; SatRep overlay: names of conceptual models
|
|
|
|
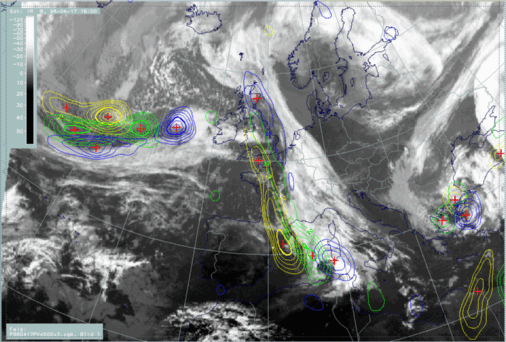
17 April 1996/18.00 UTC - Meteosat IR image; yellow: positive vorticity advection (PVA) 500 hPa 06.00 UTC, green: positive vorticity advection
(PVA) 500 hPa 12.00 UTC, blue: positive vorticity advection (PVA) 500 hPa 18.00 UTC; SatRep overlay: names of conceptual models
|
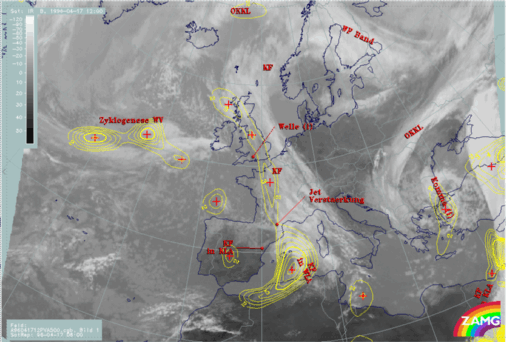
17 April 1996/12.00 UTC - Meteosat IR image; ECMWF analysis data; yellow: positive vorticity advection (PVA) 500 hPa; SatRep overlay: names of
conceptual models
|
|
|
|
|
|
17 April 1996/18.00 UTC - Meteosat IR image; yellow: positive vorticity advection (PVA) 500 hPa 06.00 UTC, green: positive vorticity advection
(PVA) 500 hPa 12.00 UTC, blue: positive vorticity advection (PVA) 500 hPa 18.00 UTC; SatRep overlay: names of conceptual models
|
17 April 1996/18.00 UTC - Meteosat IR image; ECMWF analysis data; yellow: positive vorticity advection (PVA) 500 hPa; SatRep overlay: names of
conceptual models
|
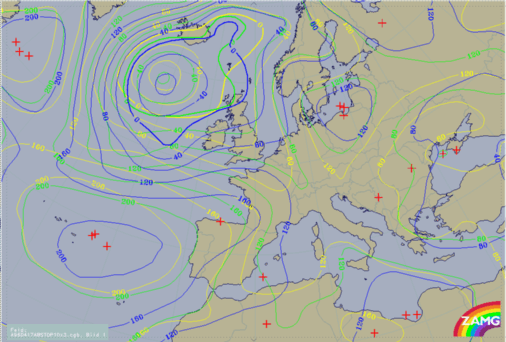
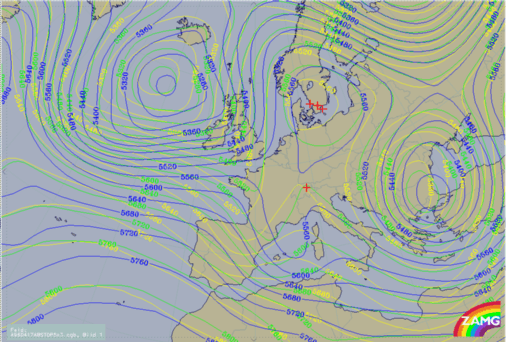
This fast development of the frontal cloud band to a cloud spiral can also be followed and predicted with help of the contour fields and shows up as a phenomenon at the 500 hPa level. While the surface low, which was connected with the eastern cloud band at 06.00 UTC, is filled until 18.00 UTC, the short Wave upper level trough develops till 18.00 UTC and becomes more and more pronounced. The two parameters of PVA and upper level height are typical indicators of the formation of such a cloud spiral.
|
17 April 1996/06.00 UTC; yellow: height contours 1000 hPa 06.00 UTC, green: height contours 1000 hPa 12.00 UTC, blue: height contours 1000 hPa
18.00 UTC
|
17 April 1996/06.00 UTC; yellow: height contours 500 hPa 06.00 UTC, green: height contours 500 hPa 12.00 UTC, blue: height contours 500 hPa
18.00 UTC
|
|
|


