29 MAY 2000 - SATELLITE IMAGES
by FMI
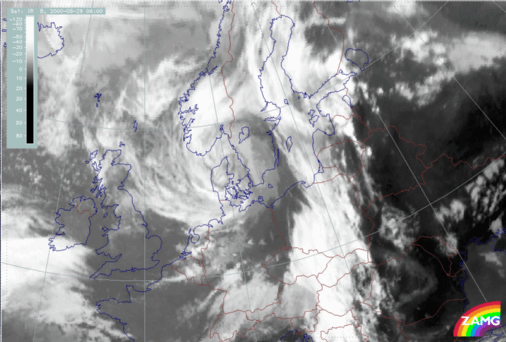
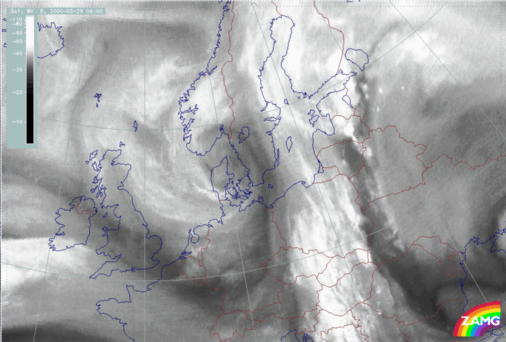
The development of the convergence line is well depicted in satellite images. The Meteosat infrared image reveals that there are some convective cloud cells over Poland, slightly ahead of the frontal cloud band, at 06.00 UTC. The Meteosat water vapour image at 06.00 UTC shows the existence of actually two Convergence Lines. Drier area is located between the Convergence Lines, which is seen as a darker north-south oriented region, roughly along 25E. In this special case the visual appearance differs slightly from a typical Non-orographic convergence line (see
Conceptual Models: Non-Orographic Convergence Lines
) in which there is only one Convergence Line, clearly separate from the frontal cloud band. Furthermore, a bright and very moist frontal zone is clearly seen in the water vapour image.
|
29 May 2000/06.00 UTC - Meteosat IR image
|
29 May 2000/06.00 UTC - Meteosat WV image
|
|
|
|
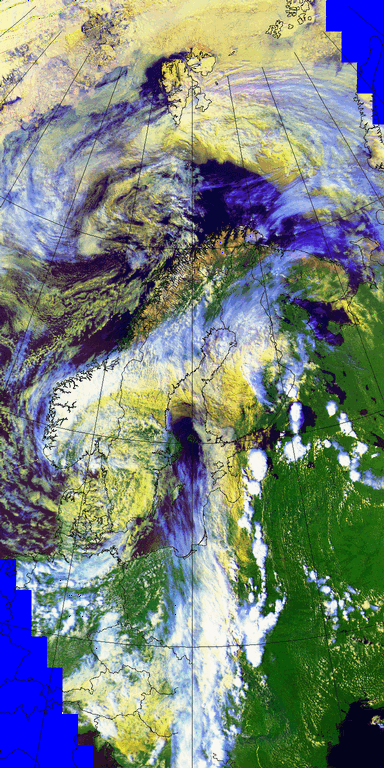
In the NOAA satellite image (at 06.43 UTC) the two Convergence Lines are more clearly seen; the first one being quite a modest feature and located immediately at the leading edge of the frontal cloud band, while another is located further east. The frontal cloud band is shown as yellow in the NOAA image (generally low clouds) in the eastern part and white or bluish white (thick or high clouds) in the western part. This means that the thickness of the frontal cloud layer grows
towards west. Hence, the NOAA image shows a marked partition between the low clouds at the leading edge of the frontal cloud band and the convergence clouds ahead of the front.
The Meteosat water vapour image at 06.00 UTC shows the partition between the two Convergence Line quite clearly, as there is a dry area between them, seen as a darker region lying in a north-south direction. The two Convergence Lines are also clearly seen as brighter regions in this image. Furthermore there is a bright and very moist frontal zone.
29 May 2000/06.43 UTC - NOAA RGB image (channel 1, 2 and 4)
The situation at 12.00 UTC differs only slightly from that at 06.00 UTC. The frontal cloud band seems a bit weaker and the convergence line situated to the east
of the front at 06.00 UTC has moved away northeast and weakened during this period of time (this is seen in the Meteosat image sequences below). Furthermore, the convective cells immediately ahead of the Cold Front are more pronounced than at 06.00 UTC. At this point in time the Convergence Line starts developing significantly. The Meteosat image sequences below show the development throughout the day. The rapid convective development starting at about 12.00 UTC is clearly seen in both the infrared and the water vapour sequences. It is clearly recognised how the convective cells at the leading edge of the frontal cloud band grow substantially between 12.00 and 13.00 UTC.
Water vapour imagery also shows the most rapid development between 12.00 and 14.00 UTC. It starts on the boundary between moist and dry air (most clearly seen at 13.00 UTC around 55N/26E). This feature is likely to be connected to Fair Weather Convectivity (see
Convective cloud features in typical synoptic environments: Fair Weather Conditions
).
The Convergence Line continues to grow larger by the hour. However, the frontal clouds seem to gradually fade away. By 17.00 UTC, the Convergence Line, with large cumulonimbus clouds, dominates the frontal cloud band. Within this region there is a thick layer of very deep clouds.
|
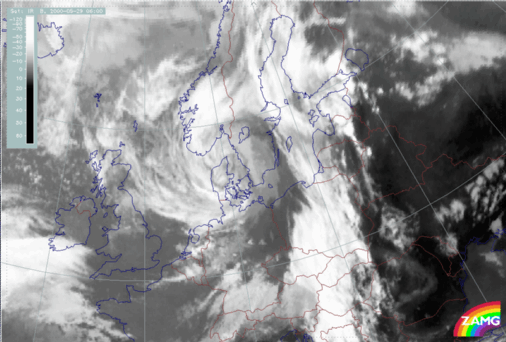
29 May 2000/06.00 UTC - Meteosat IR image
|
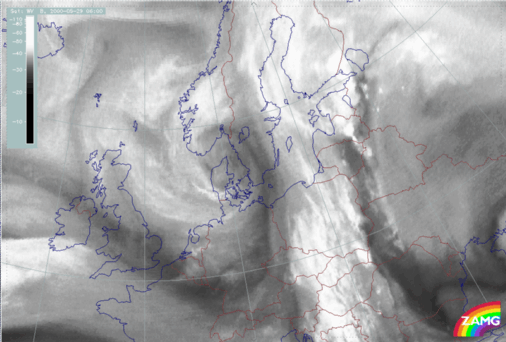
29 May 2000/06.00 UTC - Meteosat WV image
|
|
|
|
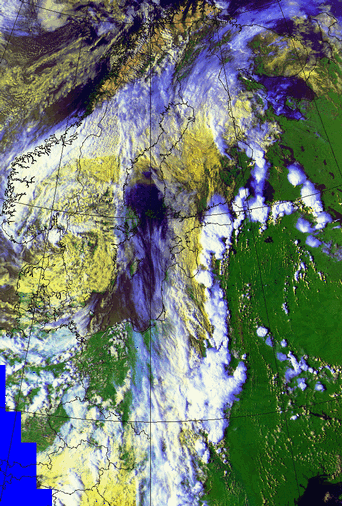
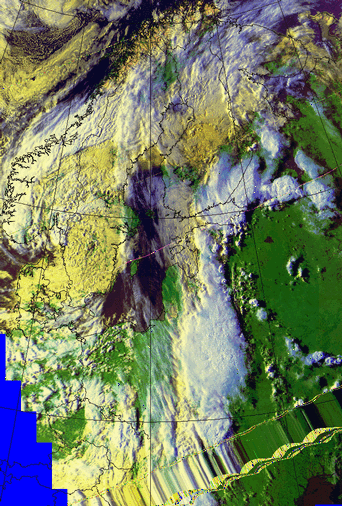
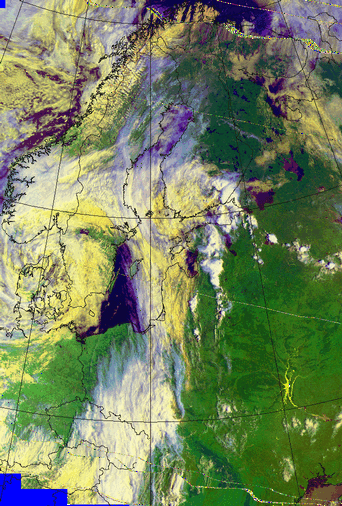
The NOAA images provide more details. The anvils of the cumulonimbus clouds are seen as bluish clouds at the edges of the bright cores of the cumulonimbus clouds. The western boundary of the convergence clouds, on the other hand, is yellowish indicating thet lower frontal clouds exist beneath the thick convective cloud layer at 13.10 and 14.29 UTC. At 16.34 UTC these clouds can still be distinguished, although they are much weaker than a couple of hours earlier. Further to the west there are still some bluish high clouds belonging to the Cold Front.
|
29 May 2000/13.10 UTC - NOAA RGB image (channel 1, 2 and 4)
|
29 May 2000/14.29 UTC - NOAA RGB image (channel 1, 2 and 4)
|
|
|
|
|
|
|
|
29 May 2000/16.34 UTC - NOAA RGB image (channel 1, 2 and 4)
|
|
As a conclusion to this subchapter, one can say that the development of the Convergence Line ahead of the Cold front is quite typical at first, when the convective cloud cells are growing in a line near the leading edge of the Cold front in the beginning of the afternoon. The explosive development later on is rather unusual. One reason for this behaviour could be some kind of interaction with the old Convergence Line, which is seen in the satellite images at 06.00 UTC and then moves towards northeast and fades away during the day.
