Warm Front Shield - Meteorological Physical Background
by ZAMG
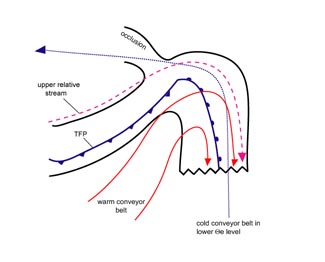
The cloudiness within the warm sector is associated with a more or less pronounced upper level front (see Typical appearance in vertical cross section) and there is a pronounced ascending Warm Conveyor Belt on the various surfaces of these frontal zones. It overruns the Cold and Warm Front surface lines (which is different from the band type) and mostly exists in a deep layer of the troposphere. This may be the reason for thick cloudiness and precipitation in the warm sector behind the surface front.
Beside this upper level frontal zone there also exists a surface level frontal zone, which is comparable to the band type. Cloudiness on this frontal zone cannot normally be differentiated in the satellite image, but can be explained in a similar way as for the band type (see Warm Front Band - Meteorological physical background ). With this type a different relative stream from behind the Cold Front has already been described, forming the high Warm Front Band cloudiness. In the shield type this relative stream can only be seen in the area of the leading edge of the shield. Therefore this stream is either overrun or shifted forward by the dominant Warm Conveyor Belt.
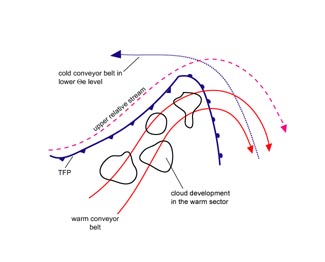
In the case of the band type, it was stated that there is not enough ascending motion with the Warm Conveyor Belt, which is the reason that no cloudiness develops. In the shield type the ascent is much stronger: either this is the characteristic of the special situation or it is the consequence of a further development of the frontal system. If the frontal surfaces approach, then the isentropic surfaces become more and more inclined leading to a stronger ascent of the relative stream. This process can often be followed in the satellite images by the development of cloudiness in the warm sector of a Warm Front band culminating in the formation of the complete cloud shield (see Cloud structure in satellite images).
|
|
|
|
3 January 2005/12.00 UTC - Meteosat 8 IR 10.8 image; blue: relative streams 300K - system velocity: 260°
8 m/s, yellow: isobars 300K
|
3 January 2005/12.00 UTC - Meteosat 8 IR 10.8 image; magenta: relative streams 308K - system velocity: 260°
8 m/s, yellow: isobars 308K
|
|
|
The most striking difference to the upper level surface is the northward shift of the ascending Warm Conveyor Belt (left image). This causes an overrunning of the frontal line at a layer of about 700 to 500 hPa.
The second relative stream from behind the Cold Front cannot be observed on this isentropic surface.
This isentropic surface is characteristic of the situation at the upper level front as well as for the warm sector.
Although this situation is rather complex, representing the development and merging of several synoptic scale systems, a lot of features described in the meteorological physical background above can be detected.
Both satellite images with superimposed relative streams show a pronounced ascending warm conveyor belt (ascent from about 600 to 400 hPa). The increase of cloudiness within the warm sector is manifested in the relevant area from Iceland to southern Norway.
|
12 February 2005/12.00 UTC - Meteosat 8 IR 10.8 image; magenta: relative streams 300K - system velocity: 325°
10 m/s, yellow: isobars 300K, position of vertical cross section indicated
|
12 February 2005/12.00 UTC - Meteosat 8 IR 10.8 image; magenta: relative streams 312K - system velocity: 325°
10 m/s, yellow: isobars 298K
|
|
|
The second figure shows, within the Warm Front Shield, an ascending Warm Conveyor Belt originating in front of the Cold Front south of the Alps (at approximately 650 hPa). Above Italy (at approximately 550 hPa) it turns from south-western to south-eastern directions where it stops ascending above Croatia (approximately between 550 to 500 hPa).


