Warm Front Band - Meteorological Physical Background
by ZAMG
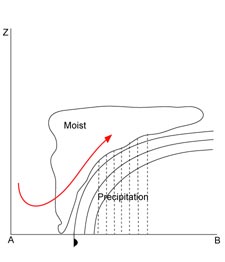
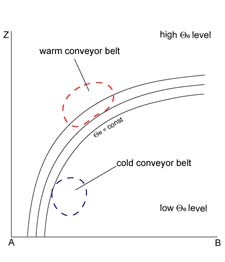
- Frontal cloud band and precipitation are in general determined by the ascending Warm Conveyor Belt, which has its greatest upward motion between 700 and 500 hPa. The Warm Conveyor Belt starts behind the frontal surface in the lower levels of the troposphere, crosses the surface front and rises to the upper levels of the troposphere. There the Warm Conveyor Belt turns to the right (anticyclonically) and stops rising, when the relative wind turns to a direction parallel to the front. If there is enough humidity in the atmosphere, the result of this ascending Warm Conveyor Belt is condensation and more and more higher cloudiness.
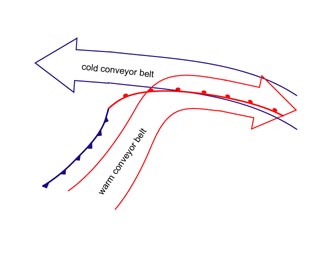
- The Cold Conveyor Belt in the lower layers, approaching the Warm Front perpendicularly in a descending motion, turns immediately in front of the surface Warm Front parallel to the surface front line. From there on the Cold Conveyor Belt ascends parallel to the Warm Front below the Warm Conveyor Belt. Due to the evaporation of the precipitation from the Warm Conveyor Belt within the dry air of the Cold Conveyor Belt, the latter quickly becomes moister and saturation may occur with the consequence of a possible merging of the cloud systems of Warm and Cold Conveyor Belt to form a dense nimbostratus.
Discussion
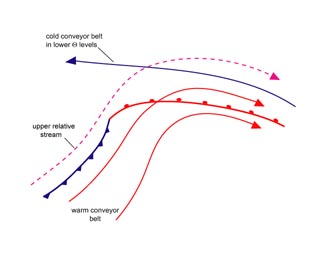
In addition to this idealized structure, the experience from a series of case studies carried out at ZAMG differs somewhat from the one described above, allowing more differentiation. In the case of a band type the Warm Conveyor Belt can be observed within the warm sector up to the Cold and Warm Front line. If there is high cloudiness in front of and parallel to the Warm Front line, it is situated within an (at least in the area of the fronts) ascending conveyor belt from the rear side of the Cold Front extending from south-west to north-east, the so-called upper relative stream. While the high cloudiness can thus be explained, the Warm Front cloudiness in the lower levels of the troposphere develops, as in the ideal case described above, within the Cold Conveyor Belt.The conveyor belt situation, especially of the Warm Conveyor Belt and the upper relative stream, described above can be found in a thick layer of isentropic surfaces, but there is some tendency for the Warm Conveyor Belt in lower layers to overrun the surface Warm Front to a small extent. The ascending Warm Conveyor Belt in the warm sector is not accompanied by appreciable cloudiness either because of too dry air masses or/and too little lifting. But it can be observed that in the ascending Warm Conveyor Belt cloudiness may develop leading to a second Warm Front type, the Warm Front Shield.
|
|
|
|
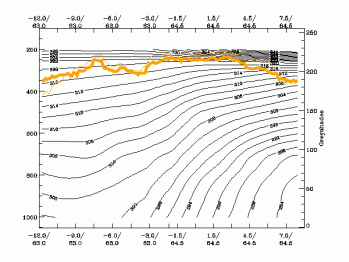
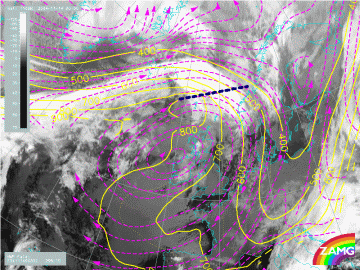
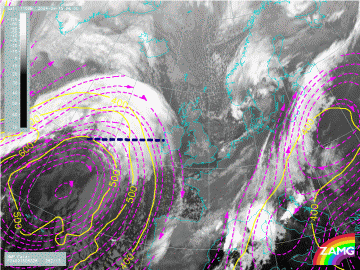
15 September 2004/06.00 UTC - Meteosat 8 IR 10.8 image; magenta: relative streams 318K - system velocity: 252°
13 m/s, yellow: isobars 318K, position of vertical cross section indicated
|
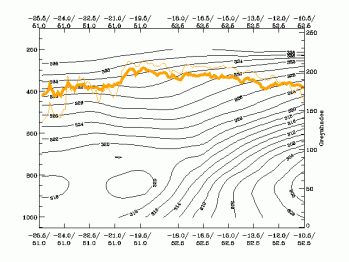
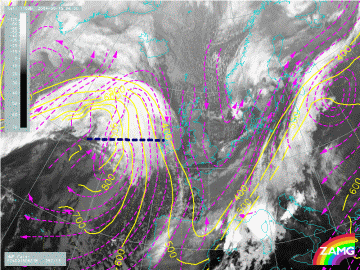
15 September 2004/06.00 UTC - Meteosat 8 IR 10.8 image; magenta: relative streams 326K - system velocity: 252°
13 m/s, yellow: isobars 326K, position of vertical cross section indicated
|
|
|
The upper levels of the troposphere are as described in the case before within the ascending part of the upper relative stream (right), which originates from the western side of the trough. The Warm Conveyor Belt can only be found within the warm sector, in front of the cloud band of the Cold Front.


