Wave - Meteorological Physical Background
by ZAMG
- Wave development in a frontogenetic pattern
- Behaviour of stable and unstable Waves
- Cyclogenesis due to superposition of upper level vorticity maxima
- Downstream and upstream development of baroclinic waves
- Orographic cyclogenesis
According to well-known polar front theory a low pressure area in the lower levels of the troposphere can develop if a small-scale disturbance is superimposed on the synoptic-scale air stream (see Key parameters ). This small-scale disturbance is caused by a transverse circulation within the baroclinic zone of the Cold Front. The transverse circulation is released by frontogenesis in the horizontal wind field that causes a fall in pressure, convergence and the production of cyclonic vorticity in the lower levels of the troposphere at the warm edge of the baroclinic zone. The consequence of this disturbance is that cold air moves south-eastward and warm air moves north-westward; this circulation is superimposed on the eastward-moving front. During this circulation a strengthening of the low pressure area occurs (as long as the frontogenesis continues) and further development of a new cyclone can be observed.
Looking only at the kinematic processes a very simple description of the development of the S-shape cloudiness as well as the typical distribution of the temperature advection field can be given. The cyclonic vorticity deforms the cloud band edge and transports cold and warm air, leading to typical positions of WA and CA maxima (see Key parameters ). The WA maximum as well as PVA within the cloud bulge, indicating the deepening of the low, contributes to the increase of cloudiness in the Wave area.
|
|
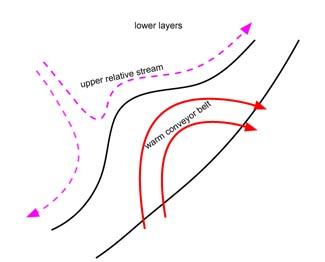
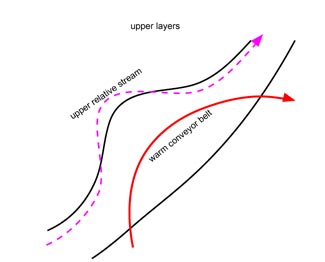
- a strongly ascending Warm Conveyor Belt accompanies the area of the cloud bulge;
- a drier stream from behind approaches this relative stream, forming a limiting stream line between both streams very close to the cloud edge;
- the higher the isentropic level the more this stream overruns the cloud bulge - this part is less bright in the WV image and is sometimes accompanied by cloud fibres in the IR image which are at the rear of the cloud bulge - this effect appears only in a very small region and is not yet well understood;
- in the lower isentropic layers relative stream lines immediately south of the Wave form a saddle point - this is a consequence of the cyclonic circulation in the Wave area in the lower layers.
|
|
- Rapid Cyclogenesis (see Rapid Cyclogenesis )
- Instant Occlusion (see Instant Occlusion )
|
16 April 2005/00.00 UTC - Vertical cross section; black: isentropes (ThetaE), orange thin: IR pixel values,
orange thick: WV pixel values
|
16 April 2005/00.00 UTC - Meteosat IR image; magenta: relative streams 304K - system velocity: 181° 13 m/s1,
yellow: isobars 304K, position of vertical cross section indicated
|
|
|


