Wave - Cloud Structure In Satellite Images
by ZAMG
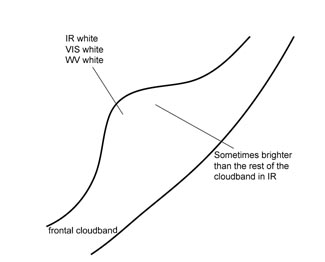
- The satellite image shows a cloud bulge at the rear edge of the cloud band of a Cold Front;
- In the VIS and IR images the area of the cloud bulge is white, indicating thick and/or multi-level cloudiness;
- In the IR image the grey shades sometimes are brighter than the rest of the cloud band;
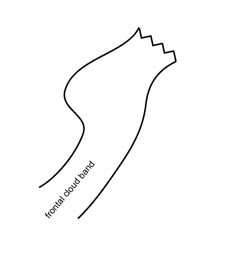
- In the initial stage the rearward cloud edge takes the form of an S-shape, which becomes more and more pronounced;
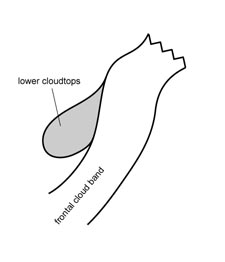
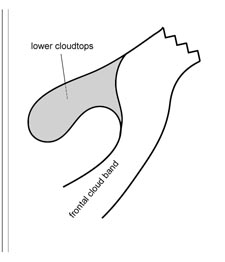
- At a later stage of development a cloud spiral develops from the cloud bulge:
|
Development directly from the white cloud band
|
Development within lower cloud emerging beneath the higher cloud layers
|
|
|
|
|
|
|
|
04 July 2005/12.00 UTC - Meteosat 8 IR 10.8 image
|
04 July 2005/12.00 UTC - Meteosat 8 WV 6.2 image
|
|
|
|
|
|
|
|
04 July 2005/12.00 UTC - Meteosat 8 VIS 0.6 image
|
|
The image reveals two Wave-like structures. One over western Europe and a second over eastern Europe. Only the
first Wave is discussed here. Within the western Wave a frontal zone from southern France (45N) across Switzerland,
France, Belgium, the Netherlands, Engeland and further northward is seen. The S-shape of the Wave bulge can be found over
Belgium, the Netherlands, the North Sea and the UK. An additional dominant feature is a Comma-like cloud spiral (over
Iceland) immediately on the cold rear side of the Wave. Such developing synoptic features can be responsible for
deviations in development of the cyclogenesis process in the Wave area. Grey shades in the IR image are brighter in the
Wave area than in the other parts of the cloud band. Especially over the Netherlands the Wave appears very bright
indicating an increased level of convectivity and possible thunderstorms. In the VIS image no differentiation in the
grey shades between the Wave area and the rest of the cloud band can be observed. This indicates multi-layered thick
cloudiness. The Wave point can be expected within the cloud band close to the point of inflexion of the S-shape of the
Wave (see Key parameters). In the WV image the water vapour Dark Stripes over Sweden and Poland and the dry intrusion
over western France are quite striking. The convection noted over the northern part of the Netherlands is well shown by
this image.
|
04 July 2005/12.00 UTC - Meteosat 8 IR 10.8 image
|
04 July 2005/18.00 UTC - Meteosat 8 IR 10.8 image
|
|
|
|
|
|
|
|
05 July 2005/00.00 UTC - Meteosat 8 IR 10.8 image
|
05 July 2005/06.00 UTC - Meteosat 8 IR 10.8 image
|
The above four slides present the sequel to the wave just discussed. At 12.00 UTC the wave is observed over western
Europe. Convective cells are embedded and cause severe weather over the Netherlands. Six hours later at 18.00 UTC the
cloud bulges has become more pronounced and transformed into an Occlusion clouds spiral. At this time step the cloud
spiral forms within the whole cloud layer.
Appearance in HRVis imagery
- HRVis images (below) show detailed cloud structures.
- Substructures in the Wave area can be seen near the cyclonic and anticyclonic region of the Wave
The RGB image presented below is built from repeated Meteosat 8 HRVis channels and the Meteosat 8 IR10.8 channel.
Several cloud types can be found within the Wave which are easily detected in this (manipulated) satellite image.
04 July 2005/12.00 UTC - Meteosat 8 RGB image (HRVis, HRVis and 10.8)
The image shows the frontal system in various shades of blue. The Wave is the striking feature in this Cold Front. The
darker blue areas mark the locations where high and thin ice clouds(cirrus) are found. The Wave itself is indicated by a
lighter blue shade which indicates that multilayered high-reaching ice clouds are found here. Along the anticyclonic
side the clouds are much more fragmented and multi-layered.