Sea-breeze - Key Parameters
by FMI and KNMI
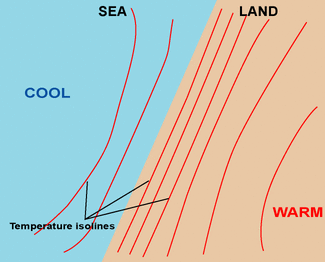
- Temperature difference between land and sea:
Cool sea adjacent to the warmer land surface. - Maximum of sensible heat flux calculated by a mesoscale model.
- Low-level geostrophic flow:
- weak geostrophic wind at lower levels favours the development of Sea-Breeze (see example below)
- A weak opposing flow in the lower troposphere (< 850 hPa) tends to increase the Sea-Breeze circulation.
- Sea-Breeze index <1 implies a lower opposite flow compared to the calculated strength of the Sea-Breeze.
- Surface winds:
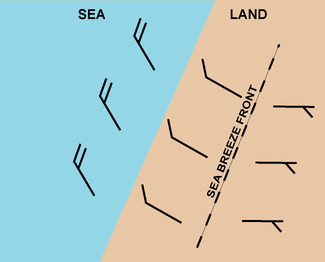
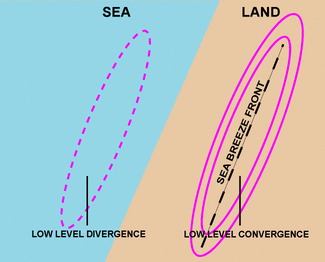
Veering with the passing through of the Sea-Breeze front, offshore wind direction changes into onshore wind direction opposite the coast-line. With the progress of the Sea-Breeze front inland the onshore wind tends to veer more and more and so diminishing the component perpendicular to the front. - Convergence near surface:
Convergence produced by opposing surface winds.
Temperature difference between land and sea
|
|
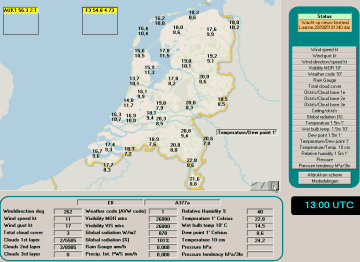
19 May 2009/13.00 UTC - T (up) + Td (down) reports over The Netherlands in Sea-Breeze circulation
|
|
|
|
|
|
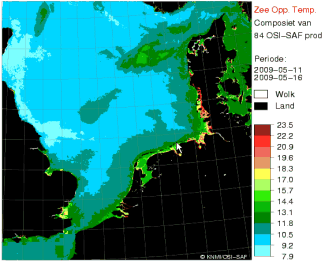
11 - 16 May 2009 - Meteosat 9 Sea Surface Temp.
|
19 May 2009/14.00 UTC - Meteosat 9 HRV image
|
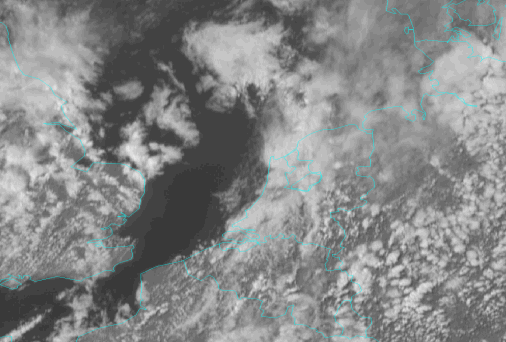
The lower images are the average sea surface temperature as measured and computed by satellite info (OSI-SAF). In the satellite image on the right side below the convective clouds of the Sea-Breeze over the west part of Holland are difficult to recognize due to the overlaying high level clouds.
Low-level geostrophic flow
Surface winds
|
|
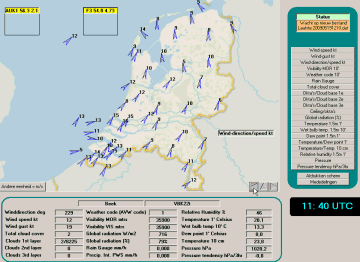
19 May 2009/11.40 UTC - Windreports over The Netherlands at the start of a Sea Breeze
|
|
|
|
|
|
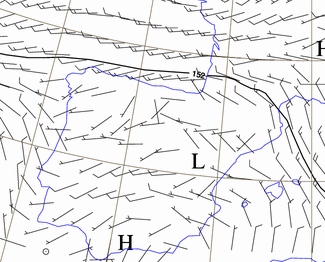
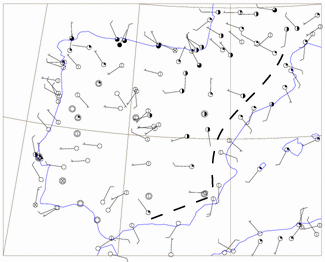
13 June 2001/12.00 UTC - surface synoptic wind observations with an estimated position of Sea-Breeze front (dashed line)
|
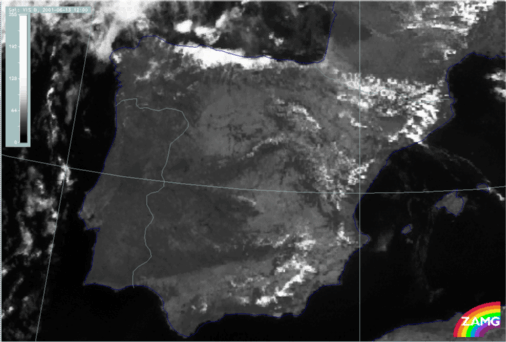
13 June 2001/12.00 UTC - Meteosat 8 VIS image
|
A Sea-Breeze observed over the Spanish south-east coast. The line of the Sea-Breeze front cannot be delineated accurately due to insufficient surface observations, but (almost acute angle) onshore wind is apparent at the coast, while inland the wind direction is more random. Some convective clouds appear on the VIS - image along the coast, from south east to east and north east on the See-Breeze front.
Even along the west and south coast of Portugal and the north coast of Spain the surface wind has much similarity with See-Breeze circulation. The Meteosat VIS - image to the right is showing hardly any clouds (low RH), so a maximum solar radiation can be expected over land with high surface temperatures. Along the north coast of Spain the See-Breeze is accompanied by low clouds from the Bay of Biscay, depicted as a large area of strong reflecting white clouds.
Convergence near surface
|
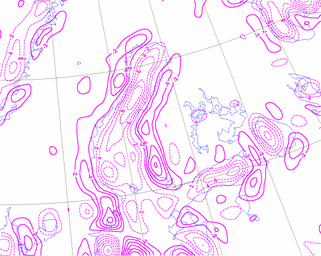
31 May 2001/12.00 UTC - convergence at 1000 hPa, magenta dashed: divergence, magenta solid: convergence
|
|
|
|
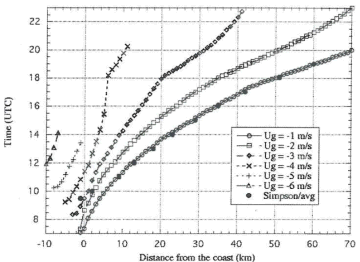
Sea-Breeze and sensible heat flux over sea and land
A study was done by using a 2D mesoscale model to calculate the maximum sensible heat flux on a specific day and a relation was found with the strength of the Sea-Breeze : Um = 0.35 H1/2max. (Um = max Sea-Breeze, perpendicular to the coastline; H1/2max = max sensible heat flux). The start of the Sea-Breeze is of course dependant on the strength of the existing and opposite surface wind Ug. A relation was found between Um and Ug called the Sea-Breeze index : Isb = Ug/Um, and with Im < 1 a high probability exist for the onset of the Sea-Breeze.A second and important relation ( X = ts (µm Um - µg Ug) was found by comparing the Sea-Breeze and the opposite wind for the calculation of the distance (X), the Sea Breeze can travel inland given a specific opposite wind. (ts = time, µm and µg are coefficients = 0.7 and 0.8). An explanation of the graphs is available in the chapter Weather Events.