Jet Fibres - Typical Appearance in Vertical Cross Sections
by DHMZ
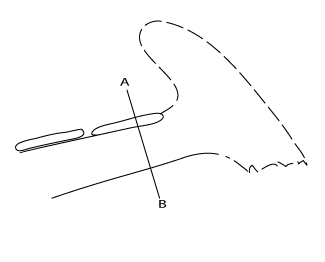
Several vertical cross-sections, perpendicular to fibres, have been examined. Typical parameters studied were:
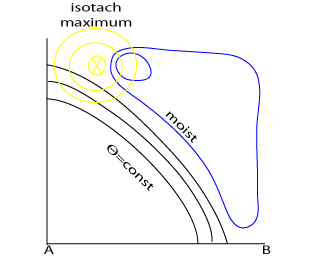
- Isotachs
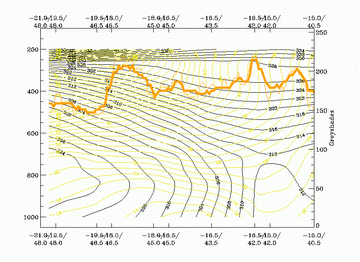
The jet streak is located near the maximum radiance in WV and IR of the fibre
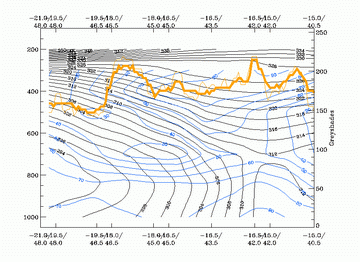
Fibres are located near to the jet axis, in most cases shifted slightly to the anticyclonic side - Relative humidity
A fibre is sometimes located near a secondary humidity maximum, but the main humidity maximum represents the frontal cloudiness. - Isentropes
The slope of the isentropes shows the frontal zone
Jet Fibres behind the Cold Front
|
|
|
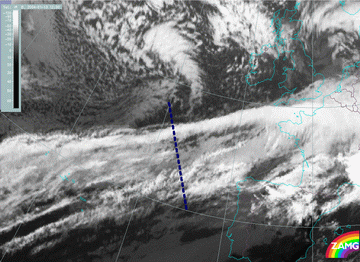
13 January 2004/12.00 UTC - Meteosat IR image; position of vertical cross section indicated
|
13 January 2004/12.00 UTC - Vertical cross section; black: isentropes (ThetaE), yellow: isotachs,
orange thin: IR pixel values, orange thick: WV pixel values
|
|
|
|
|
|
13 January 2004/12.00 UTC - Vertical cross section; black: isentropes (ThetaE), blue: relative humidity,
orange thin: IR pixel values, orange thick: WV pixel values
|
Jet Fibres above the Warm Front Shield
|
|
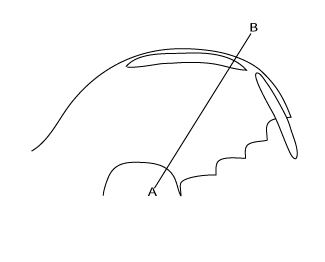
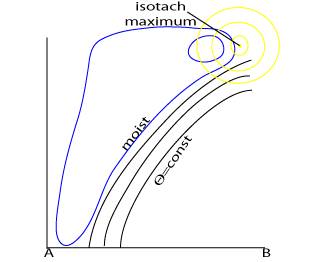
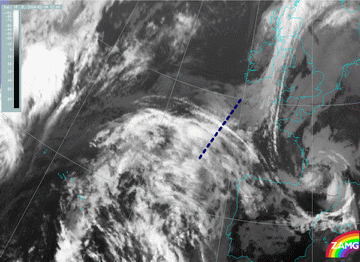
16 February 2004/12.00 UTC - Meteosat IR image; position of vertical cross section indicated
|
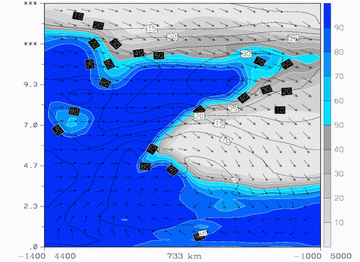
16 February 2004/12.00 UTC - ALADIN Vertical cross section; black: isotachs, blue: relative humidity,
wind arrows superimposed
|
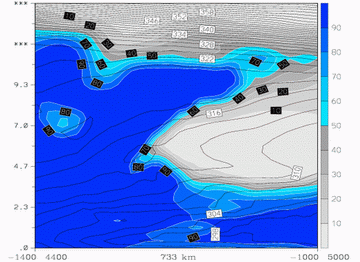
16 February 2004/12.00 UTC - ALADIN Vertical cross section; black: isentropes (ThetaE), blue: relative humidity
|
|
|
|
|
|
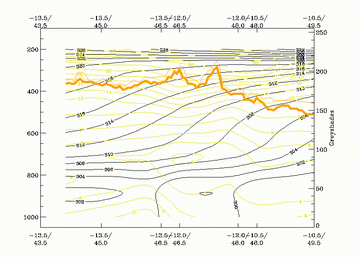
16 February 2004/12.00 UTC - Vertical cross section; black: isentropes (ThetaE), yellow: isotachs,
orange thin: IR pixel values, orange thick: WV pixel values
|
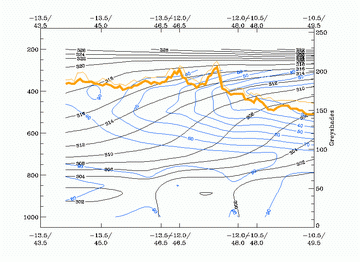
16 February 2004/12.00 UTC - Vertical cross section; black: isentropes (ThetaE), blue: relative humidity,
orange thin: IR pixel values, orange thick: WV pixel values
|
If one compares Aladin and ECMWF cross-sections, it is clear that the ECMWF model does not resolve humidity in the upper troposphere well enough. The Aladin cross sections show a much better humidity distribution along the frontal zone and in the region where Jet Fibres occur.


