Enhanced Cumulus - Convergence Lines Over Seas And Lakes
by KNMI
Direction and Magnitude of the low-level wind
|
10 November 2007/06.00 UTC - HiRLAM wind analysis at 10m
|
10 November 2007/06.00 UTC - synoptic analyses wind and temperature at the surface
|
|
|
When the wind direction is parallel to the axis of a bay or narrow strait, or with little wind, cloud lines will develop in the centre of the lake or bay. If the wind direction is at an angle to the axis of the bay, the line will be shifted towards that coastline at which the wind direction is orientated towards (see Meteorological Physical Background).
In the above image to the left the wind field, forecast over Kattegat and Sont by the HIRLAM model, has a minor angle to the coastline, not very illustrative. Near coastal regions a small change in wind speed and direction can be noticed. In the image to the right, the cooresponding synoptic analyses, the changing wind is much better depicted. Notice the strong differences in windspeed and direction over the island of Sealand and the main land of Sweden.: weaker and more backed compared to the actual reported wind at the entrance and the exit of the Sont.
Fetch
Initially the air over the continent is stable and dry. While travelling downstream over much warmer surface the air is heated and stability changes into instability. If enough moisture is picked up convective clouds start to develop. The distance between the first developed clouds of the cloud street or convergence lines and the coastal region, where the air came from, is dependent on windspeed, instability, surface temperature and humidity and called "Fetch". The general scheme of fetch is displayed in the image below left by the red arrow.Continental, arctic air is advected with a northwesterly wind (the HIRLAM analyses 850 hPa to the right) over Norway into Denmark and the southwest part of Sweden.
In this case, after a distance or fetch of about 400 km, at the end of the red arrow the first CU and CB-clouds starts to develop over the Kattegat , spreading towards the Sont, the narrow border between the two countries.
|
10 November/12.00 UTC - Meteosat 8 HRVIS image; Scheme of fetch, represent by the red arrow
|
10 November 2007/12.00 UTC - HIRLAM Analyses 850 hPa; green: RH
|
|
|
Temperature Difference between water surface and the air
As a result of temperature difference between land and water an atmospheric circulation will develop. Fluxes of sensible and latent heat from the warmer water lead to a boundary layer that is very unstable: shallow, moist convection is about to start. Studies over the Gulf of Finland show occasions with temperature difference between land and water of at least 8°C.
During the night and early morning of the 10th of November 2007 temperatures dropped to values, fluctuating from 0 degrees at the west coast of Sweden to -2 or -4 degrees more inland. Dewpoints were lowering down to -3 or -6 degrees C. At the same time screen temperature over the Kattegat remained around +4 or +5 degrees C.
In the synoptic analyses of 06.00 UTC, the first images of this chapter, these low temperatures are depicted well.
By midday, as can be seen in the synoptic analyses of 12.00 UTC below, air temperature over land rose to 4 or 6 degrees C.

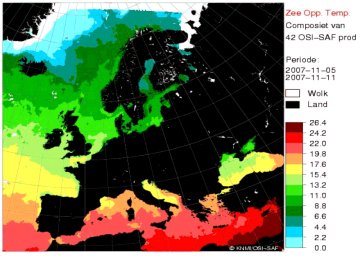
From the composite OSI-SAF product, depicted below, it is easy to determine the temperature of the sea surface in the Kattegat, Sont and west part of the Baltic Sea. Remember from the physical background a convection temperature around + 5 degrees C (diagram of Göteborg) was necessary. A sea temperature in the Kattegat around +10 degrees C (dark green color) is of course high enough for convection to start.
Low level Convergence and vertical motion
The numerical model indicates low level convergence in the area of the cloud band. As a result of the low-level convergence vertical motions and divergence patterns are expected in the lower levels of the troposphere. The images below, with the calculated divergence pattern at 10m (left) and at 850 hPa (right), are displaying what can be expected: divergence above low level convergence implies ascending air. The result is in nice correlation to the cloud street and to the vertical velocity at 850 hPa, which we met earlier in the chapter Physical Background.|
10 November 2007/12.00 UTC - HiRLAM analysis Divergence; at 10m (in blue) convergence (red) pattern
|
10 November 2007/12.00 UTC - HiRLAM analysis Divergence at 850 hPa (in blue), convergence (red) pattern
|
|
|


