Convergence Lines Over Seas And Lakes - Meteorological Physical Background

by KNMI


Convective bands are caused by low-level lines of convergence, which has been demonstrated by simulations using numerical models (Nagata et. al. 1986). They often develop in cold air outbreaks in which the coastal shape and sea-surface temperature pattern have a profound effect in establishing a low-level mesoscale circulation. Due to the large temperature difference between land and sea, offshore winds are generated. Convergence occurs when offshore winds, from opposite coasts meet each other.
The cold air stream becomes unstable due to turbulent transport of sensible and latent heat from the warm sea surface. Convergence Lines form downwind of major bends in the coastline. A bay with offshore winds is thus an ideal generation area. A good example is the development of lines over the Gulf of Bothnia as shown in chapter 1 "Cloud structure in satellite images", date March 23 2008 12.00 UTC.In general the lines are advected with the base flow and can bring large amounts of precipitation to adjacent areas.
Mesoscale structure of atmospheric structure around convergent cloud lines
Above a schematic picture of the Mesoscale structure of the atmosphere around convergent cloud lines in bays. The wind direction is parallel to the cloud lines.

The warm sea water heats the continental air from below. Focussing on the data of 10 November 2007 (see the chapter on cloud structure) and using the OSI-SAF composite image (see Key parameters) the temperature of the seawater in the Kattegat can be derived : around +10°C.

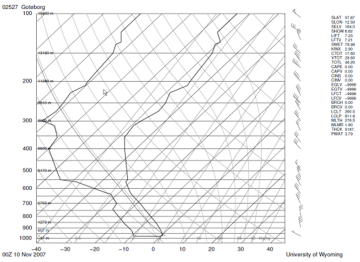
The initial temperature profile is shown by the skewT logP diagram of Göteborg , the image below.
A strong inversion at the surface ( T and Td equal to - 10°C ) exists over land as a result of night time cooling. This initial continental air is heated when advected over the warm sea with temperature around +10°C. With a convection temperature of +5 or higher convective clouds may develop over sea if enough moisture is available. Tops are expected to be near 550 hPa or 15.000ft at the height of an upper level inversion with much drier air above. Continuation of this topographical effect will result in organised convective cloud bands.

10 November 2007/00.00 UTC - SkewT logP diagram of Göteborg,
After a certain distance (fetch, Key parameters) a convergence line is generated over the Kattegat and the individual cells are advected down to the southeast with the upper wind in the lower levels. As an example the HIRLAM forecast (+12) for 12.00 UTC at 850 hPa is depicted in the image below left, together with the calculated vertical velocity in hPa/hr, red lines upward motion.
10 November 2007/12.00 UTC - HiRLAM; red: vertical motion (Omega) at 850 hPa
10 November 2007/12.00 UTC - Meteosat 8 HRVIS image
Comparing the Meteosat 8 HRVIS image, to the right, with the 850 hPa forecast to the left, the convergence line does fit with calculated upward motion through the Sont down to the west part of the Baltic Sea. Some upward motion however is forecast over Skagerrak and northern part of Denmark. The satellite image is showing no convective clouds at all. Obviously fetch and lack of enough moisture, remember the WV - image in the chapter on cloud structure, prevent the development of convective cloud.

Menu Of Convergence Lines Over Seas And Lakes
Cloud Structure In Satellite Images
Key Parameters