Convergence Lines Over Seas And Lakes - Cloud Structure In Satellite Images
by KNMI
|
10 November 2007/12.00 UTC - Meteosat 8 HRVIS image
|
10 November 2007/12.00 UTC- Meteosat 8 IR 10.8 image
|

|
|
|
12 November 2007/12.00 UTC- Meteosat 8 HRV image
|
12 November 2007/12.00 UTC- Meteosat 8 IR 10.8 image
|
|
|
|
|
|
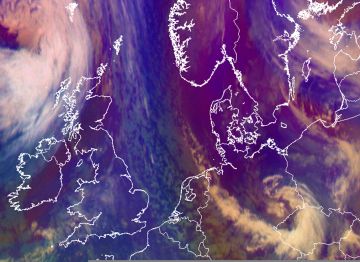
12 November 2007/12.00 UTC - Meteosat 8 AIRMASS RGB image
|
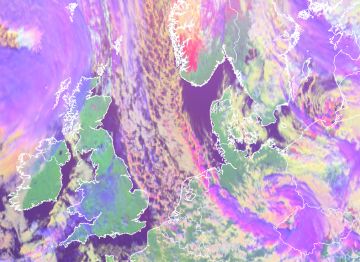
12 November 2007/12.00 UTC- Meteosat 8 Day-Microphysics RGB image
|
The Airmass RGB, down to the left, is an interesting image. The higher tops of the convergence line are depicted in white and lowering from the German Bight towards the north. In fact the blue color, extending from the UK to Denmark and Sweden, is an indication all developments take place in cold, polar air. The redish color, overhead the blue color (from Norway down to the German Bight and Luxemburg, is reflecting the dry stratospheric air above the strong northwesterly jetstream. Overall, individual cells are hardly recognizable, the image is not very helpful for the detection of the properties of the several cloud streets.
The last image of this example, the Day - Microfysics RGB to the right, has more specific information. Ice clouds have a purple colour : apparently the small and whiter clouds (from the HRV - image) appear to have icy tops.
The Comma Cloud over the Czech Republic is interestung: A nice example of Cold Air Development. On the satellite image the convergence line here is in the tail of the Comma cloud and therefore open to debate if this is really the Conceptual Model described in this chapter. Features in RGB however are very much comparable. For more information on Comma and its tail, see the Conceptual Model Comma - Cloud structure in Satellite Images.
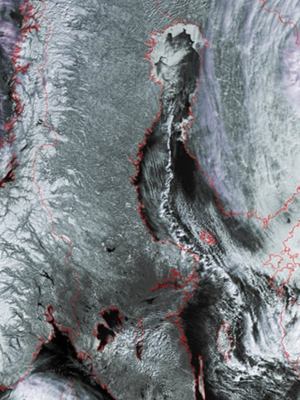
As a final example, on the 23rd of March 2008, arctic air was advected from the northern part of Sweden over unfrozen parts of the Gulf of Botnia down to the south and southeast. Cloud Streets developed at a certain distance off shore into a well pronounced convergence line with the deepening of the unstable, convective layer. In this case the advantage of a HRV-image from the NOAA Polar Satellite to the right is clear: much more detail in the structure of individual clouds and the cloud street compared to the Meteosat 8 HRVIS image to the left. From above the convergence is like a meeting-point of the Swedish and the Finnish arctic air.
|
23 March 2008/12.00 UTC - Meteosat 8 HRVIS image
|
23 March 2008/12.00 UTC - NOAA AVHRR HRVIS image
|
|
|

