Cold Front - Cloud Structure In Satellite Images
by ZAMG and FMI
- In the IR and VIS images the clouds vary between white and varying grey shades, according to their substructure and state of development.
- In the WV images the cloud band is light grey with some white spots or stripes indicating embedded thicker clouds.
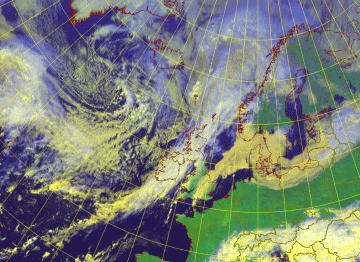
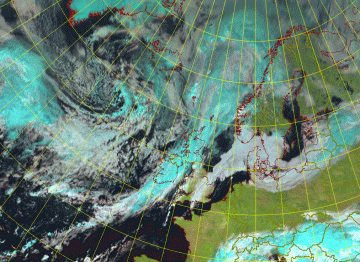
- In RGB images the different types of clouds can be more easily separated, when compared to single channel images. In the Meteosat 8 0.6; 0.8; 12.0 - combination high clouds appear bluish, thick multilayered clouds white or light grey and low clouds yellow. In METEOSAT 8 1.6; 0.8; 0.6 - combination ice clouds are cyan and water clouds grey (See Basics: Satellite Channels: Artificial and Combination Channels ).
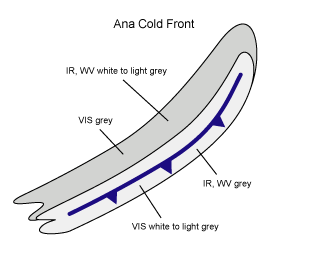
Ana Cold Front:
- Generally smooth appearance
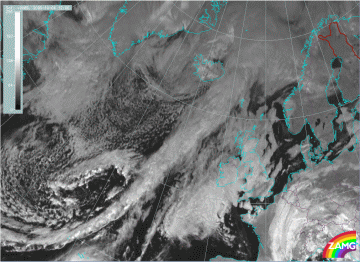
- In VIS image, the brightest area is from the leading edge to the middle part of the cloud band, indicating lower water clouds
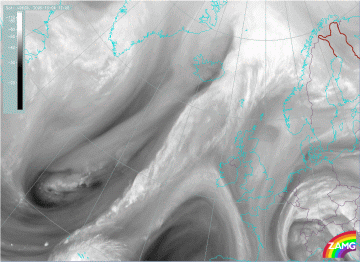
- In IR and WV images the brightest area is from the rear edge to the middle part of the cloud band, indicating cold and high cloud tops, often with embedded CBs
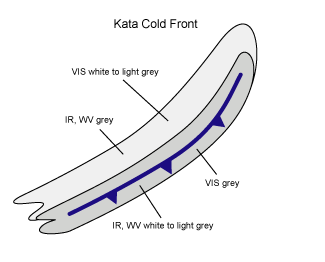
Kata Cold Front:
- Structured appearance
- In VIS image the brightest area is from the rear edge to the middle part of the cloud band, indicating lower water clouds
- In IR and WV images the brightest area is from the leading edge to the middle part of the cloud band, indicating cold and high cloud tops, often with embedded CBs
|
|
The structure of Cold Fronts may also vary according to other features attached or embedded within it. Such conceptual models are Wave, Upper Wave, Front Intensification by Jet Crossing and Front Decay. A PVA maximum may also cause additional substructure. Kata Cold Fronts can sometimes look like a Split Front.
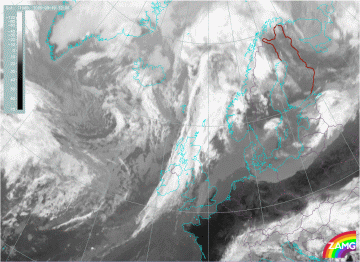
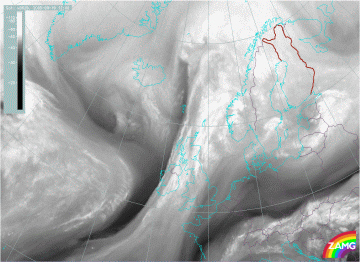
On the 19th of September 2005 at 12.00 UTC there was a Kata Cold Front stretching over Scotland and Ireland:
|
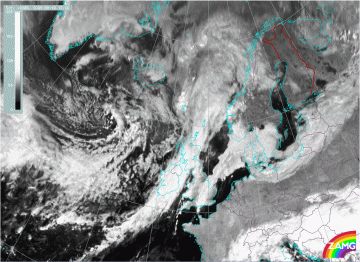
19 September 2005/12.00 UTC - Meteosat 8 IR 10.8 image
|
19 September 2005/12.00 UTC - Meteosat 8 WV 6.2 image
|
|
|
|
|
|
19 September 2005/12.00 UTC - Meteosat 8 VIS 0.8 image
|
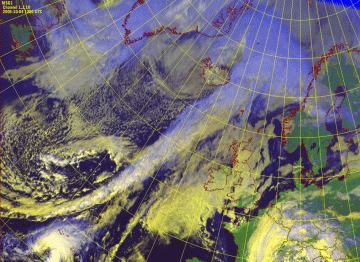
04 October 2005/12.00 UTC - Meteosat 8 RGB image (0.6, 0.8 and 12.0)
|
|
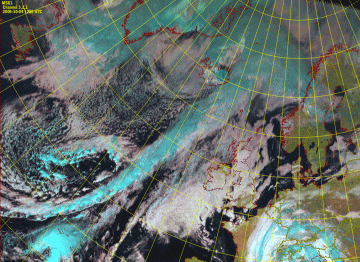
04 October 2005/12.00 UTC - Meteosat 8 RGB image (1.6, 0.8 and 0.6)
|
|
|
|
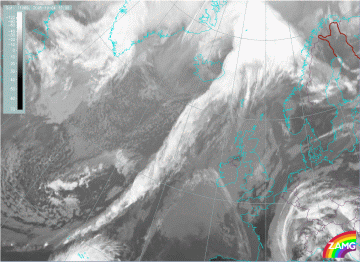
04 October 2005/12.00 UTC - Meteosat 8 IR 10.8 image
|
04 October 2005/12.00 UTC - Meteosat 8 WV 6.2 image
|
|
|
|
|
|
04 October 2005/12.00 UTC - Meteosat 8 VIS 0.8 image
|
04 October 2005/12.00 UTC - Meteosat 8 RGB image (0.6, 0.8 and 12.0)
|
|
04 October 2005/12.00 UTC - Meteosat 8 RGB image (1.6, 0.8 and 0.6)
|
|
|

