ARTIFICIAL AND COMBINATION CHANNELS
by FMI, KNMI and ZAMG
METEOSAT (MOP, MTP)
Combination VISible + InfraRed
This is a tool for a quick and easy discrimination of thick and thin cloudiness in different layers of the tropopshere. For this, the VIS image is displayed in yellow colours according to its intensity, the IR image is displayed in blue colours according to its intensity. Thus, after a superposition of both images yellow grey shades in the VIS + IR image represent low, warm cloud tops, blue grey shades only high, cold cloudiness while white to grey shades appear where signals come from both channels, being a sign for thick and/or multilayered cold cloud tops.
| Dark yellow | Land |
|---|---|
| Blue | Sea |
| White/grey | Thick, multilayered high clouds |
| Yellow | Low clouds or snow |
| Blue | Thin, high cirrus clouds |
| A1 |
The easternmost part of the frontal cloud band A located over the Ukraine
VIS + IR: yellow, some white spots within cloudiness, some blue areas at the northern boundary Conclusion: In general a frontal cloud band with low cloud tops but some higher small scale areas embedded and some high cloud fibres at the northern boundary |
|---|---|
| A2 |
The wave area over north Italy - Switzerland - west Austria and south Germany
VIS + IR: grey area north Italy - Switzerland - west Austria; transition to blue areas over Germany and the Czech Republic Conclusion: The grey area represents the thick part of the Wave bulge which can be identified much more easily in the combined image than in the separate channels; blue area is high cloud shield above |
| A3 |
Two mesoscale cells MCSs over the western Mediterranean (40.5N/03E and 41N/06E)
VIS + IR: grey areas in oval shape, small bluish areas downstream; cells embedded within yellow cloud fields Conclusion: Grey areas represent the thick part of the MCSs (thunderstorms), the blue areas the cirrus shield; both cells are embedded in low level cloud fields behind the frontal cloud band |
| B1 |
Cloud shield over the Atlantic
VIS + IR: Extended grey areas becoming more blue to the south-east Conclusion: Grey areas show thick mulitlevel cloudiness which changes to mostly high cloudiness downstream |
| B2 |
Cloud band over the Atlantic (36N/35W - 50N/30W)
VIS + IR: grey areas in the leading part of the cloud band; some small yellow areas and blue parts in the rearward half Conclusion: Rising cloud tops from the leading to the rearward edge and change from thick multilayered parts to only thin high cloudiness at the rear |
| B3 |
Cloud spiral west of the cloud shield (around 57N/36W)
VIS + IR: grey cloud spiral becoming yellow to the spiral centre Conclusion: Thick multilayered cloudiness in the eastern part of the Occlusion spiral, transition to only low cloudiness at the rearward edge and in the spiral centre |
| D1 |
Cloud cells west of the Comma feature and the Norwegian coast:
VIS + IR: yellow area with some white spots and lines, and bluish lines Conclusion: Widespread area of low cloudiness with some thick cells and lines of cells at the boundaries of these lines; some high cloudiness is indicated by the blue colour |
| D2 |
Cloud cells west, north-west of Scotland and north Ireland
VIS + IR: yellow area with cellular structure Conclusion: Area with cold air cells with only low vertical extension; especially compared to D1 |
NOAA AVHRR
Combination InfraRed 4 - InfraRed 5
The difference in brightness temperatures of the IR 4 and IR 5 channels is mainly caused by differences in emissivity of the underlying surfaces. The differences due to radiative transfer in the atmosphere are of only minor importance.This implies that IR 4 - IR 5 differences allow the detection of objects for which the emissivity is significantly different at the wavelengths of these channels. Since for both land and sea surfaces these emissivities have little dependence on wavelength, we can look at objects with emissivity differences for these channels. It has been shown that ice displays a significant wavelength dependence on its emissivity in this range of the spectrum.
Thus is it possible to link IR 4 - IR 5 differences exceeding a certain threshold (different over sea or land) to the presence of cirrus clouds, even if these are not optically dense (semi-transparent).
Combination InfraRed 4 - Near InfraRed 3,7
The spectral variation of the emissivity of small liquid water droplets results in an emissivity difference between these two channels, whereas land and sea surfaces display no spectral variation of their emissivities between these channels.Under the condition that no reflected sunlight is present in the NIR 3,7 channel, i.e., during night-time, it is possible to detect the presence of clouds with small water droplets, i.e., low clouds.
Combination RGB display of channels VISible 1 + VISible 2 + InfraRed 4
When during daytime the information of the VIS 1 channel is displayed on the red channel of a colour display, the VIS 2 channel in the green and the IR 4 channel in the blue, one gets an image where the various colours have the follow meaning:
| Green/yellow | Land |
|---|---|
| Deep blue | Sea |
| White | Thick, high clouds |
| Yellow | Low clouds or snow |
| Purple/blue | Cirrus clouds |
Combination RGB display of channels Near InfraRed 3,7 + InfraRed 4 + InfraRed 5
When during nigh-ttime the information of the NIR 3,7 channel is displayed on the red channel of a colour display, the IR 4 channel in the green and the IR 5 channel in the blue, one gets an image where the various colours have the follow meaning:
| Brown/grey | Land |
|---|---|
| Deep blue | Sea |
| White | Thick, high clouds |
| Brown | Low clouds |
| Blue | Cirrus clouds |
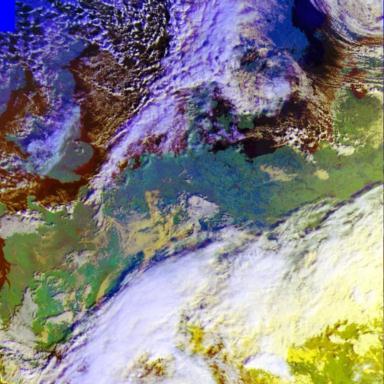
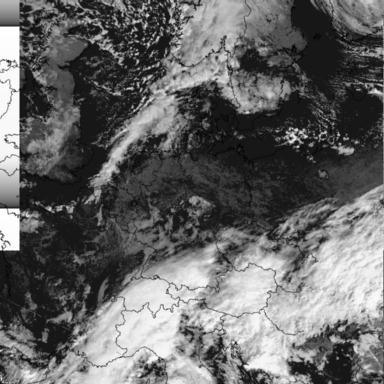
Examples of the AVHRR channel combinations
Area to be examined:
| In western upper corner | Great Britain |
| In eastern upper corner | Baltic Sea |
| Below in western corner | North-eastern Spain |
| Below in eastern corner | Balkans |
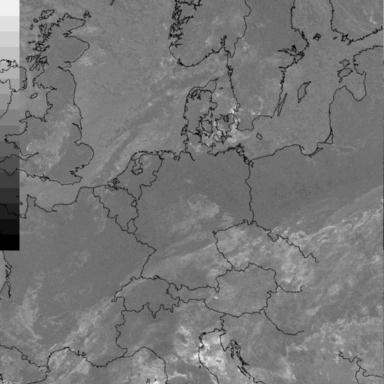
Differences can be found in the upper part of the picture:
|
|
19 October 1998/07.20 UTC - NOAA RGB image (channels 1, 2 and 4)
|
|
|
|
| Clouds or Surface | Colour |
|---|---|
| Thick and cold clouds | White or bluish white |
| Thin and cold clouds | Light blue |
| Middle level clouds | White or yellowish white |
| Low level clouds | Yellow to sand brown |
| Land surface | Dark green |
| Ocean surface | Dark blue |
| Ice and snow | Yellowish white |
Multiple channel image gives the best three dimensional impression from the cloud fields and gives more accurate details about the structure of cloud surface. Coldest clouds are seen bluish white. Middle level clouds are white or sometimes yellowish white. Low clouds have yellow or yellowish white shades. Small separate Cu cells arranged in streets have sand brown colour.
Advantage compared to the VIS 1 image, that in 1, 2 and 4 image coastlines are better detected and use of different colours is helpful when differentiating cloudiness at different altitudes.
Large cloud band over lower part of the image:
Conclusion: Perhaps Wave or at least Wave - like band over Middle Europe. Over North Sea typical cold air cloudiness of the open cells. Cb type cloudiness at the western edge of the cloud band over Norway and North Sea. |
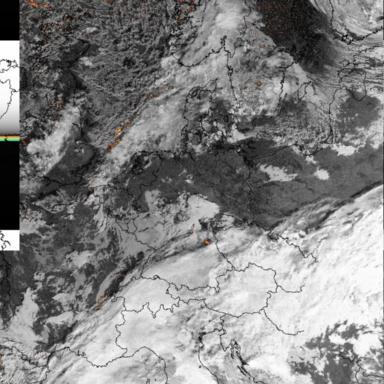
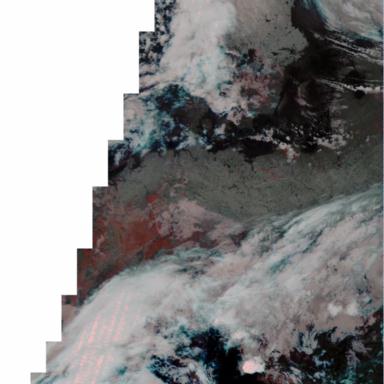
AVHRR - channel combination Near InfraRed 3,7 + InfraRed 4 + InfraRed 5
|
19 October 1998/04.52 UTC - NOAA RGB image (channels 3, 4 and 5)
|
|

|
|
| Clouds or Surface | Colour |
|---|---|
| Thick and cold clouds | White |
| Thin and cold clouds | White or bluish white |
| Middle level clouds | Light red to grey |
| Low level clouds | Red - grey to dark grey |
| Land surface | From grey to red - grey (or light grey if very cold) |
| Ocean surface | Black or dark red |
| Ice and snow | Light red-grey |
Since very thin and cold clouds appear slightly colder in channel 5 than in channel 4, these cloud types have bluish appearance during night-time. Low level clouds change from the blue grey colour during day to dark red during night-time. There are difficulties in the ability to separate thin Cirrus clouds at night. Especially troublesome is the separation of thin Cirrus overlying low clouds from cold land surfaces.
|
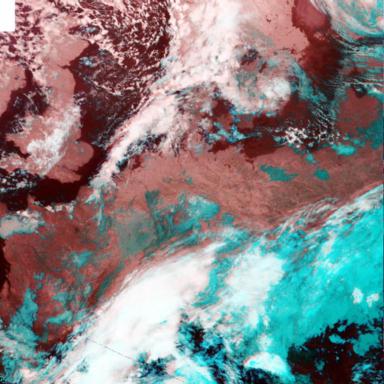
19 October 1998/07.20 UTC - NOAA RGB image (channels 3, 4 and 5)
|
|
|
|
| Clouds or Surface | Colour |
|---|---|
| Thick and cold clouds | White or bluish white |
| Thin and cold clouds | Variable from light red to light cyan |
| Middle level clouds | Cyan |
| Low level clouds | Dark cyan to dark blue |
| Land surface | Dark reddish |
| Ocean surface | Light to dark reddish |
| Ice and snow | Light red |
During day, the coldest high level clouds composed of ice crystals have mainly bluish white colour but the same appearance can also be shown by lower clouds with large water droplets. Therefore 3 4 and 5 channels composite image is more difficult to interpret than 1, 2 and 4 channel combination. In the case of thin transparent Ci clouds, the colour depends on the underlying surface (or layer). Over land or sea Ci cloud may be light red and over lower clouds light cyan. Almost all low- and mid-level water clouds have a cyan to dark blue grey appearance.
|
Comments from large cloud band same as with channel 3 (compare
Basic channels
). The wave-like band and also cloud patch over Hungary white. Otherwise clouds eastwards have cyan colour. Difference from
channel 3 is that below in the right corner of the picture the cloudless area is seen as dark red or almost black. In the
image of channel 3.7 land as well as clouds were black. In this image the white clouds in middle Europe are clearly fibrous.
On the other hand the cyan cloud area has more miscellaneous features. The low clouds and fog areas over Germany and France
also have a cyan colour. East of the Netherlands cyan cloud area is more vague and darker which probably means fog or thin
stratus. Narrow grey lines over France are probably connected to low fog over rivers and valleys. Cloud band from the
Netherlands northwards has distinct Cu form, especially over Norway. High Cu clouds over sea are seen white and lower clouds
dark grey or cyan.
Conclusion: Sea and land easy to detect as well as high clouds from lower clouds. Lowest clouds and fog are found as grey. Cu form cloudiness with embedded smoother lower clouds can be detected. |
AVHRR - channel combination VISIBLE 1 - (- Near InfraRed 3,7)
Large anticyclonically curved cloud band or Wave on lower part of the picture:
Land marks, rivers and coastlines:
Cu cloudiness over Scotland and southern Norway with open cells and with different vertical extension can be seen as well as Cu clouds over Baltic Sea and Baltic countries. Highest cloud cells are seen as white spots and lower clouds have grey colour. Another cloud band extending from the Netherlands to southern Norway:
|
Artificial Channels
Meteosat: InfraRed development image
Deviation images: These are motion-corrected difference images; several steps are necessary for their computation:- Two consecutive images are used for deriving the atmospheric motion field (AMVs: Atmospheric Motion Vectors)
- The second image is traced backward by means of this AMV field; this computation leads to a motion-corrected image
- The first and the motion-corrected image are subtracted: if the changes in cloudiness between two consecutive images were a
consequence of advection only, the difference signals would be zero;
But: in reality the difference signals are not zero, which means that additional processes are also responsible for the cloud changes: new development or decay of cloudiness - The motion corrected difference image is called: development image
| White signals | New cloud development |
|---|---|
| Black signals | Cloud decay |
| Grey signals | No non-advective changes |
This is demonstrated with the following example from 29 July 1997.
|
29 July 1997/14.00 UTC - IR enhanced image
|
29 July 1997/15.00 UTC - IR enhanced image
|
|
|
The use of such development images is relatively new and has to be investigated in much more detail in the near future, but it has already turned out to contain important signals within the life cycle of some conceptual models like Wave developments (compare Wave ) and, as described above, MCCs and MCSs (Mesoscale Convective Complexes and Systems respectively) (compare Cumulonimbus (Cb) and Mesoscale Convective System (MCS) ).

