STORM CATASTROPHE 13 - 16 NOVEMBER 2001 - MAIN FEATURES
by FMI
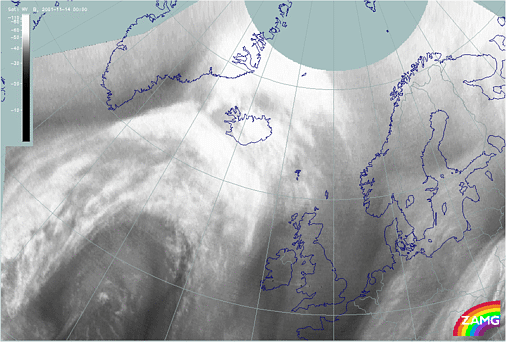
Tropopause fold and Water Vapor Eye
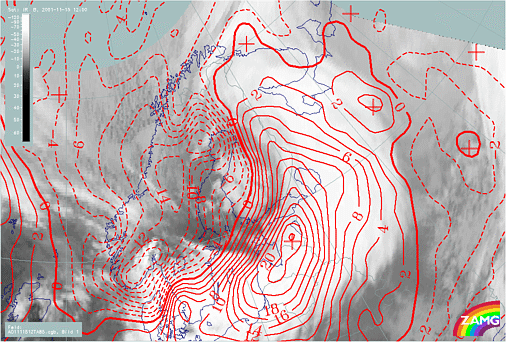
A major tropopause fold developed to the lee side of Greenland in a rapidly strengthening upper level flow. When the jet stream swept over southern Greenland on 13 November 2001 at 00.00 UTC, jet maxima were near 60 m/s and a long Dark Stripe, seen in the WV imagery, reached from the jet axis to the left exit region. This can be seen in the loop below.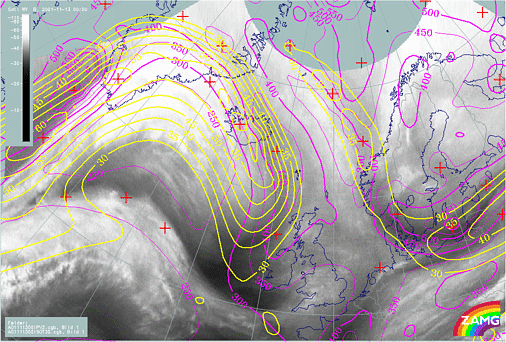
The jet stream became stronger by some 15 m/s, according to the model fields. The Occlusion over the central parts of Greenland moved eastwards over the sea. A long and strong westerly jet existed between southern Greenland and Norwegian Sea. Its maximum speed was over 80 m/s. Because the jet curved anticyclonically over Finland towards the southwest it allowed the storm to arrive in Finland with all its power.
|
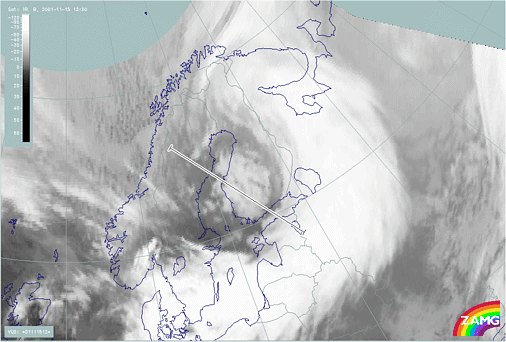
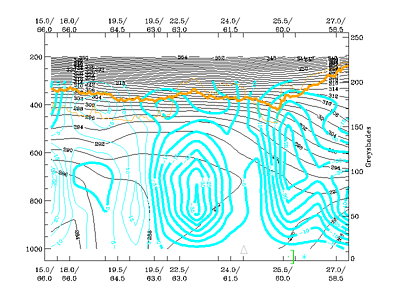
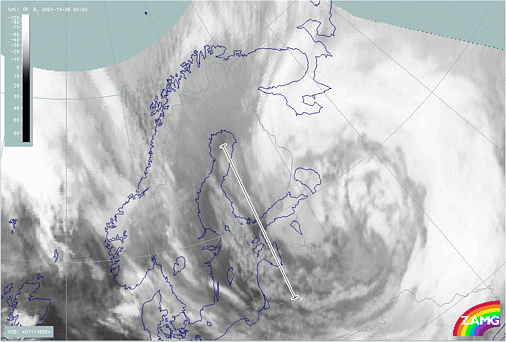
15 November 2001/00.00 UTC - Meteosat IR image; position of vertical cross section indicated
|
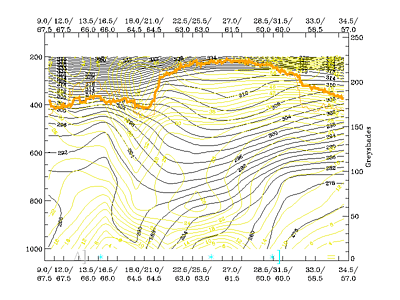
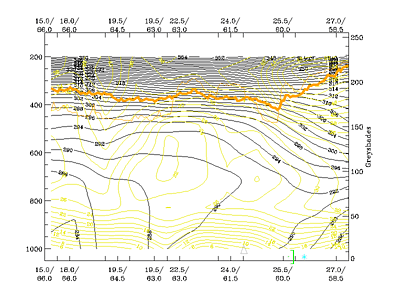
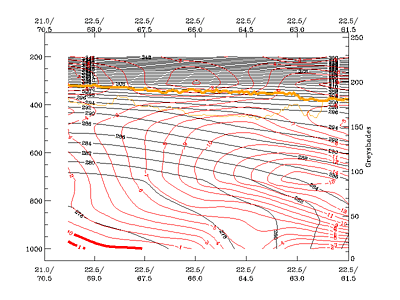
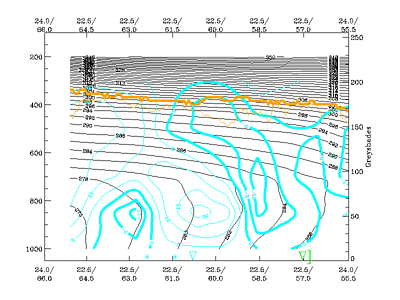
15 November 2001/00.00 UTC - Vertical cross section; black: isentropes (ThetaE), green: potential vorticity, orange thin: IR pixel values,
orange thick: WV pixel values
|
|
|
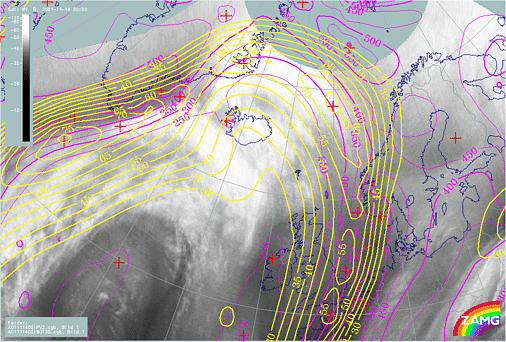
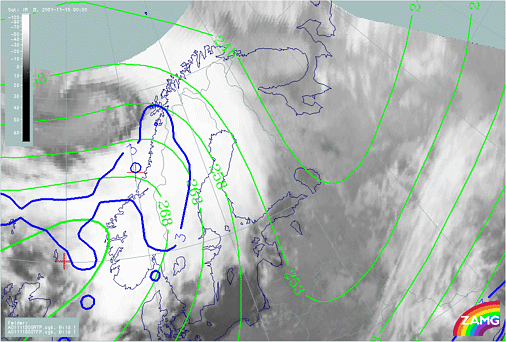
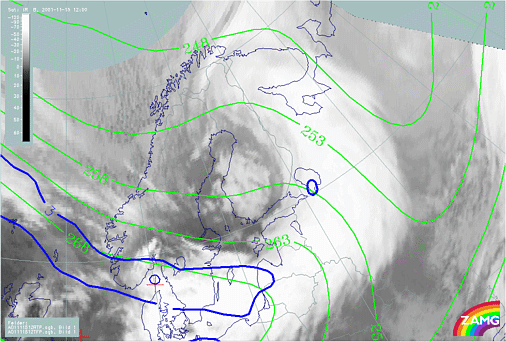
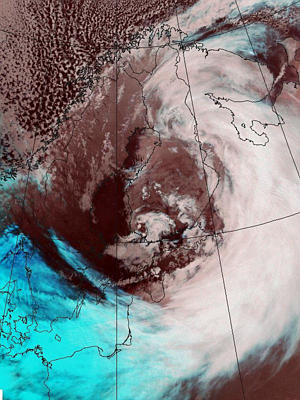
As the Water Vapour Eye grew in size, it turned more oval in appearance. During this stage, small scale cloud features began to develop within the Water Vapour Eye. The Water Vapour Eye was situated within an area enclosed by a Kata Cold Front, a Warm Conveyor Belt Type Occlusion and an Arctic Cold Front. The frontal structures cannot be seen very clearly in TFP image; only the Warm Front over the Scandinavian mountains and the Cold Front over the Norwegian Sea are clearly seen, while the TFP is below threshold value for the Occlusion spiral over the Arctic Sea.
|
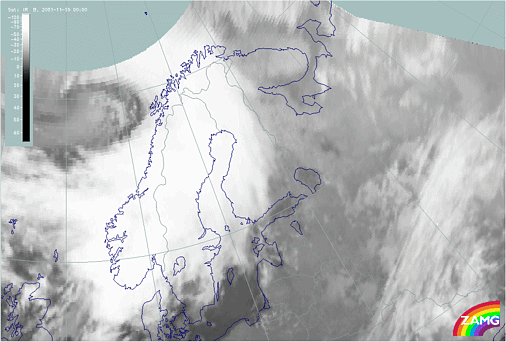
14 November 2001/00.00 UTC - Meteosat IR image
|
15 November 2001/00.00 UTC - Meteosat WV image
|
|
|
|
|
|
15 November 2001/00.00 UTC - Meteosat IR image; blue: thermal front parameter (TFP), green: thickness 500/850 hPa
|
Occluded front and low level winds over Finland
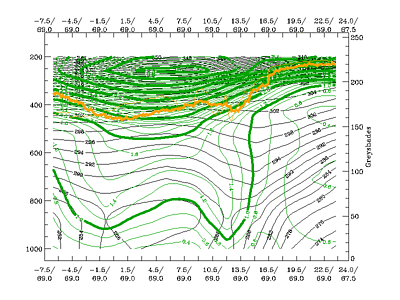
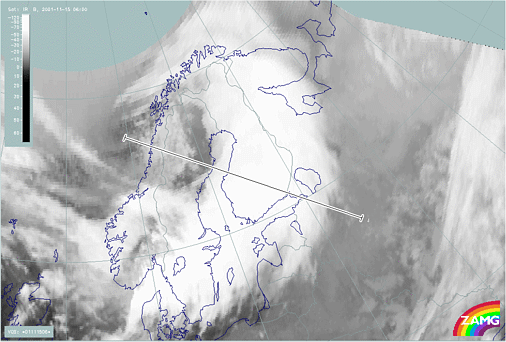
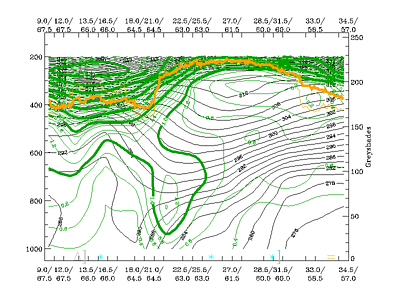
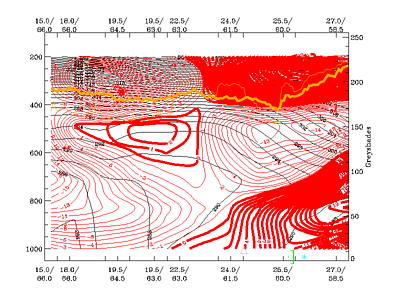
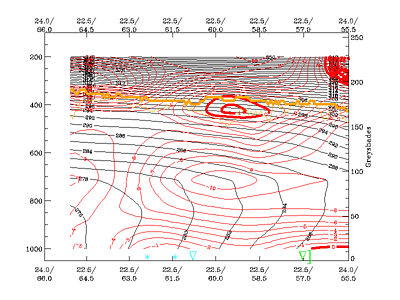
The following images show a cross section through the cloud system during the period when the occluded front had already reached Finland. Isotaches show very clearly the low-level jet which can be seen at 850 hPa, maximum wind speed being 28 m/s. Similar speeds for southerly or southwesterly wind gusts over the sea were observed in southern Finland, which was located within the warm sector at that time.The tropopause fold can also be seen very clearly, PV>1 values extending down to around 900 hPa. The location of this anomaly coincides with the Occlusion point.
The extremely intensive temperature advection is seen in the respective (lower right) cross section. Warm advection extends throughout the troposphere, with its maximum being at 700 hPa; the cold advection at the rear of the Occlusion front is also very pronounced.
|
15 November 2001/06.00 UTC - Meteosat IR image; position of vertical cross section indicated
|
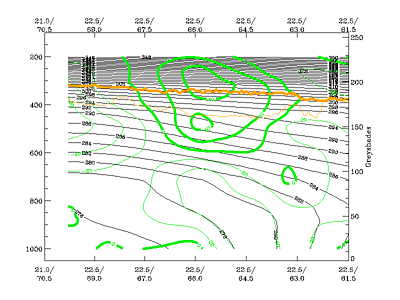
15 November 2001/06.00 UTC - Vertical cross section; black: isentropes (ThetaE), yellow: isotachs, orange thin: IR pixel values,
orange thick: WV pixel values
|
|
|
|
|
|
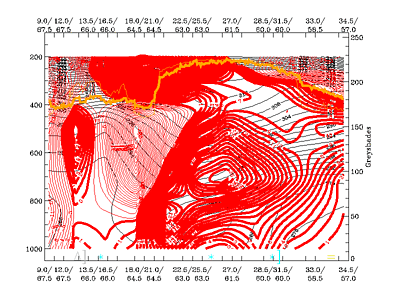
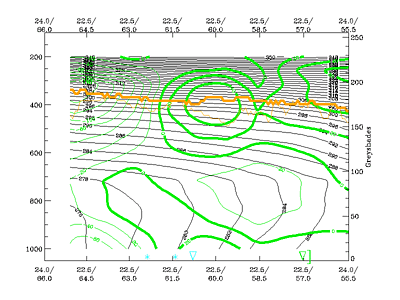
15 November 2001/06.00 UTC - Vertical cross section; black: isentropes (ThetaE), green: potential vorticity, orange thin: IR pixel
values, orange thick: WV pixel values
|
15 November 2001/06.00 UTC - Vertical cross section; black: isentropes (ThetaE), red: temperature advection, orange thin: IR pixel values,
orange thick: WV pixel values
|
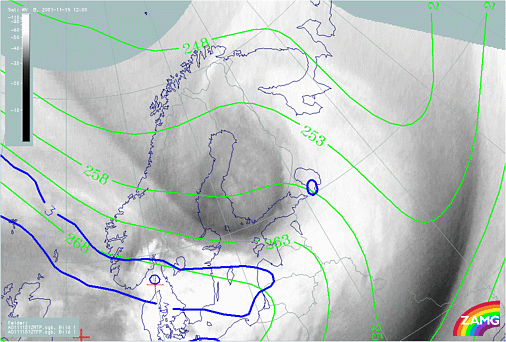
The following images show the location of the occlusion at 12.00 UTC on 15 November 2001. The frontal cloudiness is now moving away from Finland; TFP is, surprisingly, very low but warm and cold advection are still extreme.
|
15 November 2001/12.00 UTC - Meteosat IR image; blue: thermal front parameter (TFP), green: thickness 500/850 hPa
|
15 November 2001/12.00 UTC - Meteosat IR image; red: temperature advection 850 hPa
|
|
|
Cloud features behind the Occlusion
The following image loop shows the passage of the system southeastwards over Finland. Behind the main Occlusion cloud spiral, convective clouds develop and a couple of them acquire a Comma cloud appearance as they move across Finland.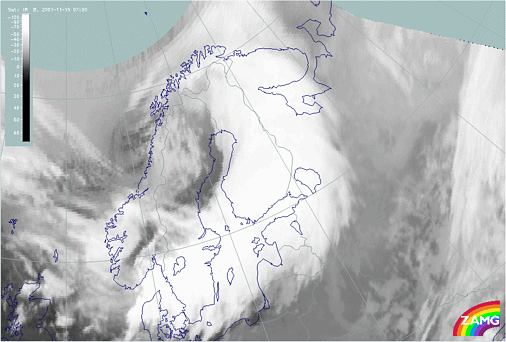
|
16 November 2001/06.00 UTC - Meteosat IR image; position of vertical cross section indicated
|
16 November 2001/06.00 UTC - Vertical cross section; black: isentropes (ThetaE), yellow: isotachs, orange thin: IR pixel values, orange
thick: WV pixel values
|
|
|
|
|
|
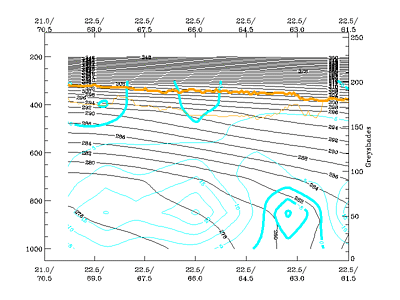
16 November 2001/06.00 UTC - Vertical cross section; black: isentropes (ThetaE), cyan thick: vertical motion (omega) - upward motion,
cyan thin: vertical motion (omega) - downward motion, orange thin: IR pixel values, orange thick: WV pixel values
|
16 November 2001/06.00 UTC - Vertical cross section; black: isentropes (ThetaE), red: temperature advection, orange thin: IR pixel
values, orange thick: WV pixel values
|
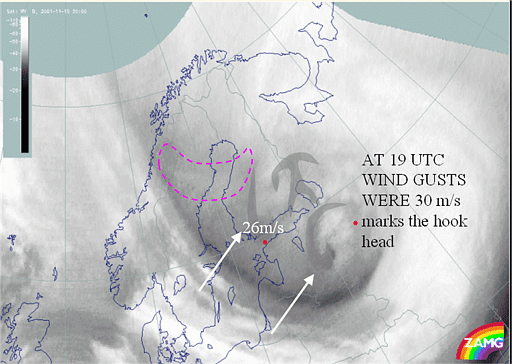
Dark Stripes
Dark Stripes (seen in the WV images) formed around the Water Vapour Vortex which, by 15 November 00.00 UTC, reached the Scandinavian mountains and moved further southeast. As the vortex reached the northern Scandinavian mountains it already began to stretch and deform into several diverging Dark Stripes. The diverging Dark Stripes behaved differently over Finland as is seen in the following loops.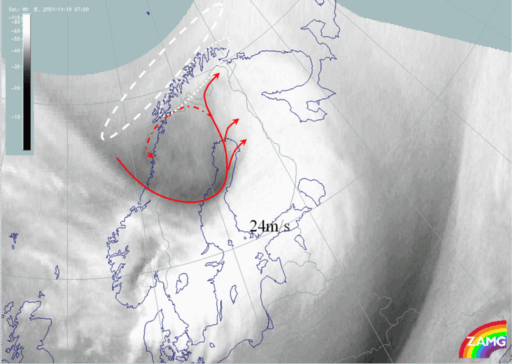
A hook that formed from the tail of the longest clockwise turning branch moved separately southwards. Strong wind gusts were associated with this dark hook: over the sea above 32 m/s, and over the land between 22-28 m/s. The wind gusts observed were strongest in the southern head of the hook. For instance, as the hook head was over Tampere (62N/25E) at 18.00 UTC, wind gusts rose from 18 m/s up to 28 m/s. Two hours later the hook head was over Helsinki (60N/25E), and wind gusts there increased by some 10 m/s, reaching 26 m/s.
White arc line and the gravity wave
During the late evening and night a curved white area approached Finland from the Barents Sea. At 21.00 UTC the white area had shrunk into a narrow white arc line. To the lee of the Scandinavian mountains the white arc line propagated 43 m/s in a north-south direction.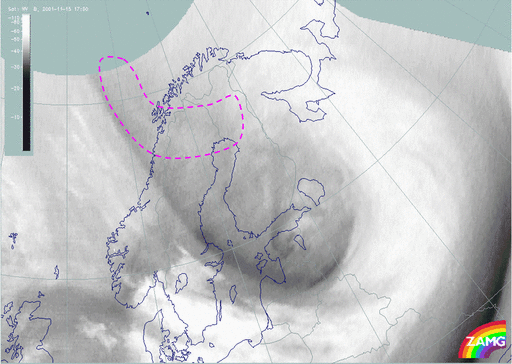
A trough area can be seen in relative topography charts; the trough deepens and moves parallel to the white arc line.
Vertical cross sections and the gravity wave
The development of the gravity wave, deeper into the troposphere, is best seen with the help of vertical cross sections.Warm advection increases remarkably from 15 November 2001 at 18.00 UTC to 16 November 2001 at 00.00 UTC in the upper troposphere in the area where upward motion dominates. This is due to the release of latent heat. Upward motion and convergence strengthen significantly in six hours. At 00.00 UTC, in the area of the gravity wave, there is already a small peak in the WV signal, and the lowering of IR values is even clearer.
|
15 November 2001/18.00 UTC - Meteosat IR image; position of vertical cross section indicated
|
16 November 2001/00.00 UTC - Meteosat IR image; position of vertical cross section indicated
|
|
|
|
|
|
15 November 2001/18.00 UTC - Vertical cross section; black: isentropes (ThetaE), red: temperature advection, orange thin: IR pixel
values, orange thick: WV pixel values
|
16 November 2001/00.00 UTC - Vertical cross section; black: isentropes (ThetaE), red: temperature advection, orange thin: IR pixel
values, orange thick: WV pixel values
|
|
15 November 2001/18.00 UTC - Vertical cross section; black: isentropes (ThetaE), cyan thick: vertical motion (omega) - upward motion,
cyan thin: vertical motion (omega) - downward motion, orange thin: IR pixel values, orange thick: WV pixel values
|
16 November 2001/00.00 UTC - Vertical cross section; black: isentropes (ThetaE), cyan thick: vertical motion (omega) - upward motion,
cyan thin: vertical motion (omega) - downward motion, orange thin: IR pixel values, orange thick: WV pixel values
|
|
|
|
|
|
15 November 2001/18.00 UTC - Vertical cross section; black: isentropes (ThetaE), green thick: vorticity advection - PVA, green thin:
vorticity advection - NVA, orange thin: IR pixel values, orange thick: WV pixel values
|
16 November 2001/00.00 UTC - Vertical cross section; black: isentropes (ThetaE), green thick: vorticity advection - PVA, green thin:
vorticity advection - NVA, orange thin: IR pixel values, orange thick: WV pixel values
|
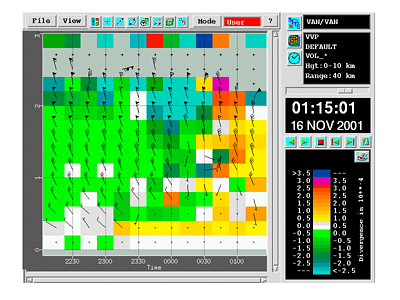
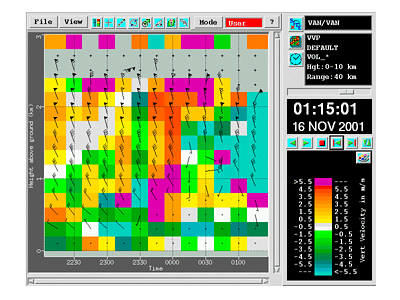
Supplementary Doppler radar information
The gravity wave travelled over Helsinki between 23.30 and 00.30 UTC and caused very strong wind gusts. These can also be observed in radar images. In the left radar image (below) divergence is presented in the reddish colours and convergence in the greenish colours. In the right radar image (below), the reddish colours indicate upward motions, while downward motion is shown with the greenish colours.In these Doppler images we see that at 23.00 UTC downward motion near the surface exceeds 5,5 m/s (turquoise). Above 1 km, upward motion is dominating.
At 23.30 UTC there is very strong downward motion in the whole boundary layer. Near the surface the downburst has possibly caused a "bounce" of airflow upwards and, therefore, the velocities just near the surface are a bit weaker than in the layer between 0,5-1km.
Between 23.45 and 00.00 UTC upward motion strengthens above 5,5 m/s (magenta). After a calmer period with weak or moderate downward motion, downward motion increases again above 5,5 m/s. At that time, according to the Doppler radar, the downbursts caused 5,5 m/s upward motion right at the surface.
Alternating periods of gusty and calmer winds lasted throughout the night in a rather organized fashion.
|
15 November 2001/22.30 UTC - Helsinki Radar image; red: divergence, green: convergence
|
16 November 2001/22.30 UTC - Helsinki Radar image; red: upward motion, green: downward motion
|
|
|


