15 - 16 MARCH 1998 - 15.00 - 18.00 UTC - FRONTAL DIAGNOSIS - USE OF VERTICAL CROSS SECTIONS

by ZAMG


15 March 1998/18.00 UTC - Meteosat IR image; position of vertical cross section indicated
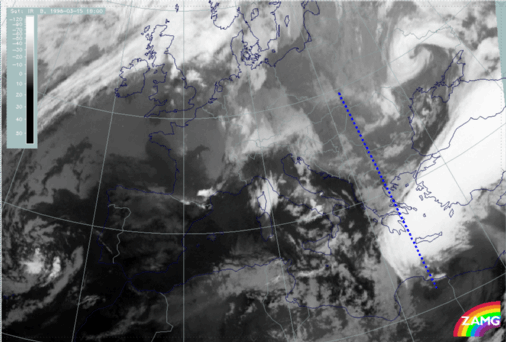
The image above shows the relation of the vertical cross section line to the cloud bands. Both the low cloudiness over Greece and the Aegean Sea as well as the bright white cloud band in the Mediterranean are cut perpendicularly.
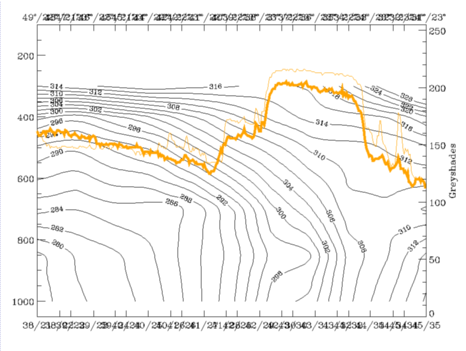
15 March 1998/18.00 UTC - Vertical cross section; black: isentropes (ThetaE), orange thin: IR pixel values, orange thick: WV pixel values
How the relevant features look in the vertical can be seen in the image above. The broad main peak in IR and WV between 36N/23E and 34N/23E represents of course the bright cloud band in the Mediterranean; the lower peak immediately northward between 40N/22E and 38N/23E represents the low cloudiness connected with the northern frontal zone. The isentropes show still two separated downward inclined frontal surfaces with surface fronts close to 33N/23E as well as 38N/23E. Both frontal surfaces show a superadiabatic inclination in the lowest layer up to about 800 hPa; isentropes between the two frontal surfaces show intensive instability there.
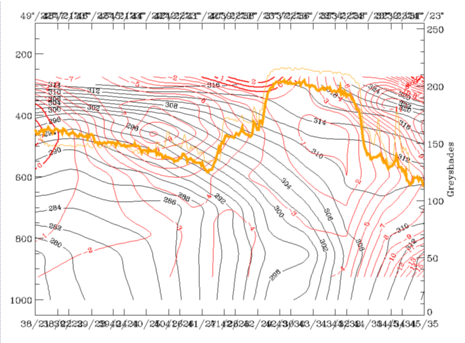
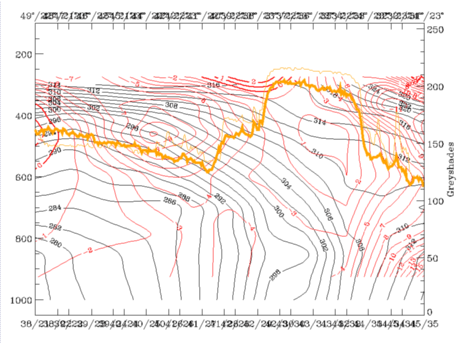
15 March 1998/18.00 UTC - Vertical cross section; black: isentropes (ThetaE), red thin: temperature advection - CA, red thick: temperature advection - WA, orange thin: IR pixel values, orange thick: WV pixel values
In the cross section above temperature advection is superimposed; there is CA within the whole vertical cross section.
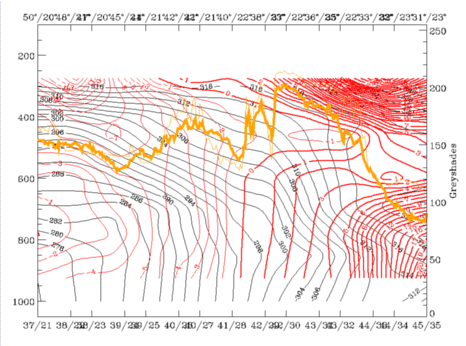
15 March 1998/06.00 UTC - Vertical cross section; black: isentropes (ThetaE), red thin: temperature advection - CA, red thick: temperature advection - WA, orange thin: IR pixel values, orange thick: WV pixel values
15 March 1998/12.00 UTC - Vertical cross section; black: isentropes (ThetaE), red thin: temperature advection - CA, red thick: temperature advection - WA, orange thin: IR pixel values, orange thick: WV pixel values
15 March 1998/18.00 UTC - Vertical cross section; black: isentropes (ThetaE), red thin: temperature advection - CA, red thick: temperature advection - WA, orange thin: IR pixel values, orange thick: WV pixel values
As the geographical position of the vertical cross section has stayed the same during the last 12 hours, the advection of cold air from the north and from the west can clearly be followed from the sequence of cross sections for 06.00 UTC (left image top), for 12.00 UTC (right image top) and for 18.00 UTC (left image bottom).
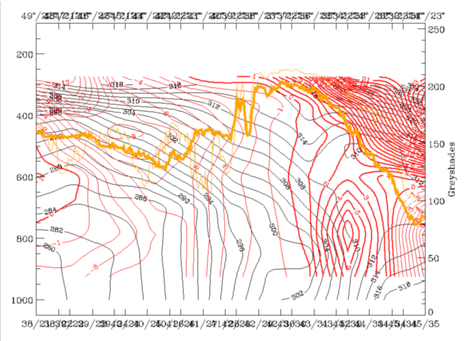
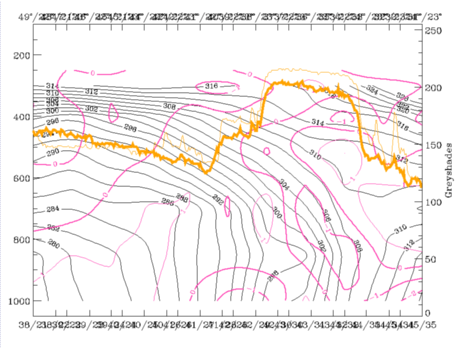
15 March 1998/18.00 UTC - Vertical cross section; black: isentropes (ThetaE), magenta thin: divergence, magenta thick: convergence, orange thin: IR pixel values, orange thick: WV pixel values
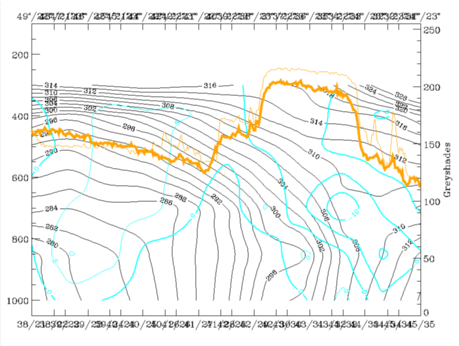
15 March 1998/18.00 UTC - Vertical cross section; black: isentropes (ThetaE), cyan thick: vertical motion (omega) - upward motion, cyan thin: vertical motion (omega) - downward motion, orange thin: IR pixel values, orange thick: WV pixel values
Also in the divergence field (left image) a continuous development can be observed during the last 12 hours. The southern frontal zone is still accompanied by a typical zone of convergence. In the low layers of the northern frontal zone some convergence has developed already six hours before and still exists there, but at 18.00 UTC a newly developed small upper level convergence area can be localized at 41N/22E at 700 hPa. This supports the idea that there is some potential for development connected with the low cloud system. The relation between convergence and vertical motion (right image) is very classical, revealing a typical frontal circulation at the southern frontal zone but also some upward motion up to 750 hPa.

SUB-MENU OF 15 - 16 MARCH 1998
15.00 - 18.00 UTC - KEY PARAMETERS ON ISOBARIC SURFACE
15.00 - 18.00 UTC - FRONTAL DIAGNOSIS - RELATIVE STREAMS AND CONVEYOR BELTS