29 - 30 JANUARY 1998 - FURTHER DEVELOPMENT OF THE OCCLUSION

by FMI


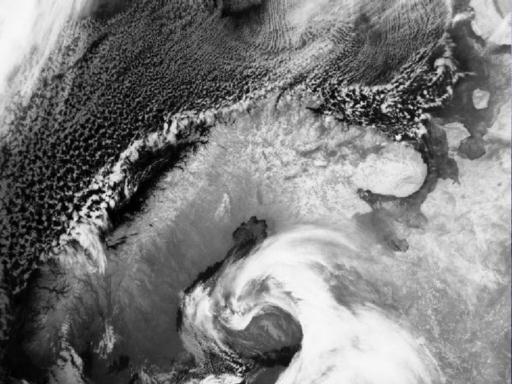
30 January 1998/11.25 UTC - NOAA CH4 image
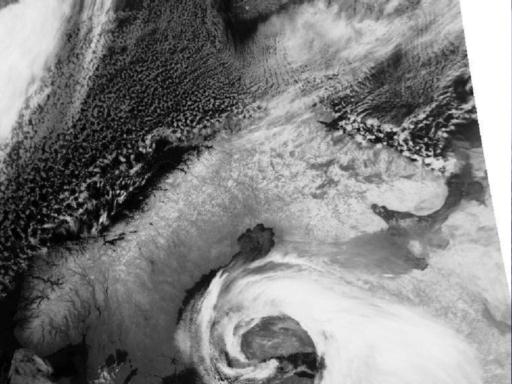
30 January 1998/15.54 UTC - NOAA CH4 image
The typical appearance of a mature occluded low can be seen in these polar orbit satellite images. The rotation of the cloud spiral around the Upper Level Low continued throughout the day. The EC/Comma cloud seen at 06.00 UTC over east Sweden quickly propagated towards the south and was located around Stockholm at noon and over the Baltic Sea in the afternoon, being still identifiable in the 15.54 UTC NOAA image (left image) west of Estonia. Intensive lines of bright cloud bands were formed over the Bothnian Sea. The bands grew during the day; extremely heavy snow showers were associated with these cloud bands.
30 January 1998/06.00 UTC - Meteosat IR image; yellow: height contours 500 hPa 06.00 UTC, green: height contours 500 hPa 12.00 UTC, blue: height contours 500 hPa 18.00 UTC
30 January 1998/06.00 UTC - Meteosat IR image; yellow: height contours 1000 hPa 06.00 UTC, green: height contours 1000 hPa 12.00 UTC, blue: height contours 1000 hPa 18.00 UTC
The low pressure centre moved slowly towards Estonia and did not deepen any more, as the Upper Level Low (left image) caught the surface low centre (right image) leading to vertical tilt of the surface low - upper level low axis. Associated with a quick rise of pressure on the rear side of the low the pressure gradient became very tight between Sweden and Finland. Winds over this area increased a lot during the day with maximum values exceeding 30 m/s on the Sea of Åland in the afternoon of 30 January. The combined effect of extreme winds and snowfall resulted in exceptionally hazardous weather in areas of Finland and Sweden.
30 January 1998/06.00 UTC - Meteosat IR image; yellow: positive vorticity advection (PVA) 500 hPa 06.00 UTC, green: positive vorticity advection (PVA) 500 hPa 12.00 UTC, blue: positive vorticity advection (PVA) 500 hPa 18.00 UTC
30 January 1998/06.00 UTC - Meteosat IR image; yellow: thermal front parameter (TFP) 500/850 hPa 06.00 UTC, green: thermal front parameter (TFP)# 500/850 hPa 12.00 UTC, blue: thermal front parameter (TFP) 500/850 hPa 18.00 UTC
The PVA maximum (left image) connected with the cold front band over the Baltic Sea can be followed across the Baltic States to White Russia, intensifying there. The secondary maximum over south Sweden is shifted southwards, intensifying as well.

The TFP (right image) moves southward till 18 UTC with the Cold Front part entering Poland and the air mass boundary extending from the North Sea to south Denmark. The Occlusion part propagates to the south-east as well.


SUB-MENU OF 29 - 30 JANUARY 1998
DIAGNOSIS OF PRECIPITATION PATTERNS WITH HELP OF RELATIVE STREAMS AND NORDRAD RADAR
ADDITIONAL INVESTIGATION: COMPARISON OF HIRLAM FIELDS VS. ECMWF FIELDS OF ISOTACHS AND PVA AT 300 HPA