29 - 30 JANUARY 1998 - RAPID DEVELOPMENT - SATELLITE OVERVIEW

by FMI


As the most striking cloud structure features were still located north of 60° latitude, the geostationary satellite data is not the best tool for visualizing the development of cloud systems. For this reason a series of consecutive NOAA satellite passes are shown in the following:
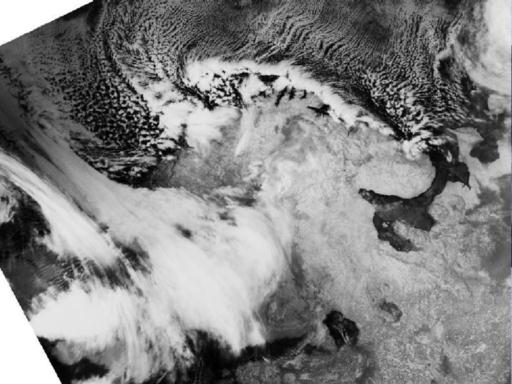
29 January 1998/14.36 UTC - NOAA CH4 image
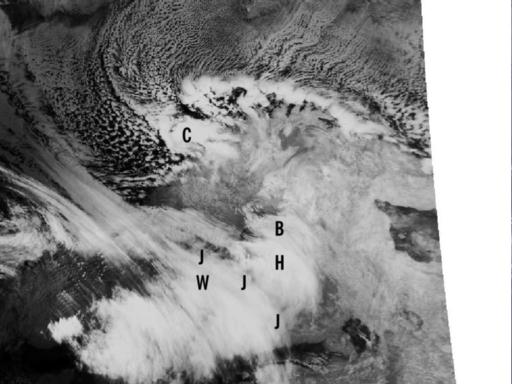
29 January 1998/16.16 UTC - NOAA CH4 image; B: cloud bulge, C: Comma, H: cloud head, J: Jet Fibre Cloudiness, W: Wave
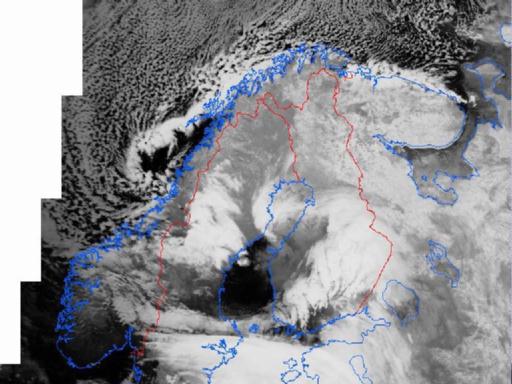
30 January 1998/01.29 UTC - NOAA CH5 image
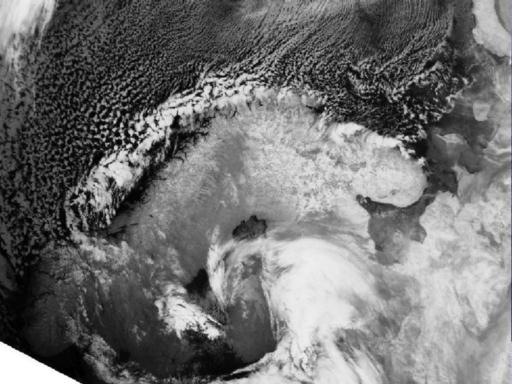
30 January 1998/06.02 UTC - NOAA CH4 image
The sequence of four NOAA IR channel (channel 4 or channel 5) images are shown to visualize the evolution of the wave cloud into a spiral-formed mature occluded storm. The first two images show the development a few hours after 12.00 UTC. These images show quite complex structures in the developing Wave (marked with W in 16.16 UTC image (right image top)). The cloud head (marked respectively with H) is becoming more and more pronounced. The images show also yet another cloud bulge emerging from beneath the cloud head (marked with B). The Jet Fibre Cloudiness indicating the location of the jet streak is also clearly seen (marked with J). A distinct Comma cloud pattern (marked with C) associated with the upper level trough can be seen north of the Lofoten Islands.

Unfortunately there is a several hours gap in NOAA passes during the evening and night. However, the first image for 30 January at 01.29 UTC (left image bottom) indicates that during the evening and night the system has developed considerably from a Wave into a cyclone with spiral cloudiness rotating around the vortex (centred in west Finland). The former head of the cloud is most probably seen almost as a separate hammer-like feature around 65N/22E.

The continuing development can be seen in the 06.02 UTC image (right image bottom) for the same day. This image indicates that the cloud vortex is very intensive. The cloud mass with the brightest tops has moved further south-east. The former head of the cloud is now moving southwards in a strong northerly air stream.


SUB-MENU OF 29 - 30 JANUARY 1998
RAPID DEVELOPMENT - INTRODUCTION
DIAGNOSIS OF SURFACE AND UPPER LEVEL LOWS