29 - 30 JANUARY 1998 - THE SYNOPTIC SITUATION OVER THE ARCTIC SEA BEFORE THE DEVELOPMENT
by FMI
|
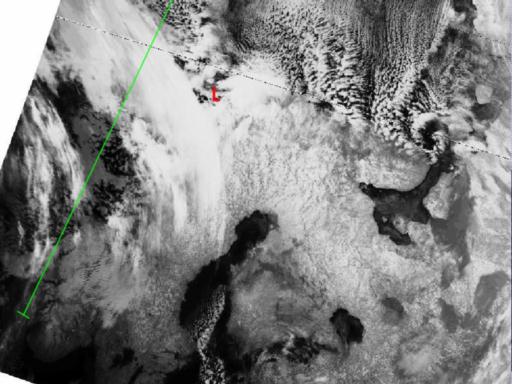
29 January 1998/01.44 UTC - NOAA CH4 image; red: location of the surface low; position of vertical cross section indicated
|
29 January 1998/00.00 UTC - Vertical cross section; black: isentropes (ThetaE), red thin: temperature advection - CA, red thick: temperature
advection - WA, orange thin: IR pixel values, orange thick: WV pixel values
|
|
|
The cross section shows the shallow nature of the fresh arctic cold advection. Around the area of interest (approximately 70N/10E) the cold advection is limited to the lowest 2 - 3 kilometres, which is a typical feature for arctic systems. Therefore stretching of the scale in the lowest 2 -3 kilometres would be appropriate when analyzing the cross sections of arctic (shallow) systems.
Another typical feature for the Arctic Front is the notable temperature gradient across the front. In this case the surface temperature difference was large (up to 20 degrees per 300 km on the area south of Bear Island).


