02 - 03 AUGUST 1997 - OVERVIEW OF SATELLITE IMAGERY FOR 03 AUGUST 06.00 UTC
by ZAMG
|
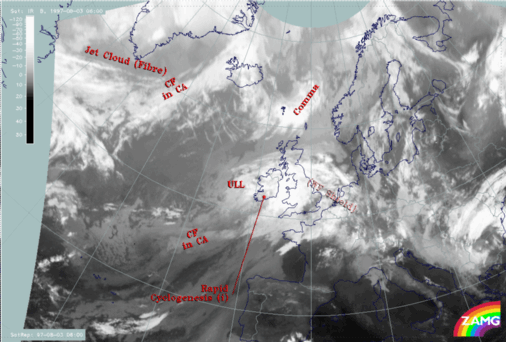
03 August 1997/06.00 UTC - Meteosat IR image; SatRep overlay: names of conceptual models
|
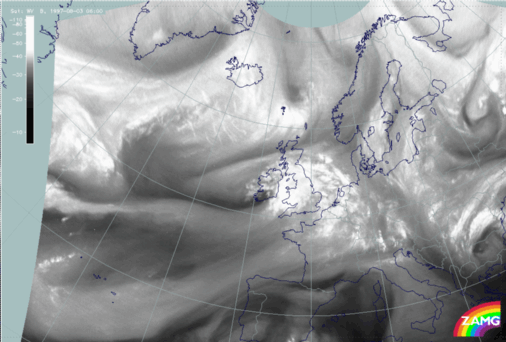
03 August 1997/06.00 UTC - Meteosat WV image
|
|
|
|
|
|
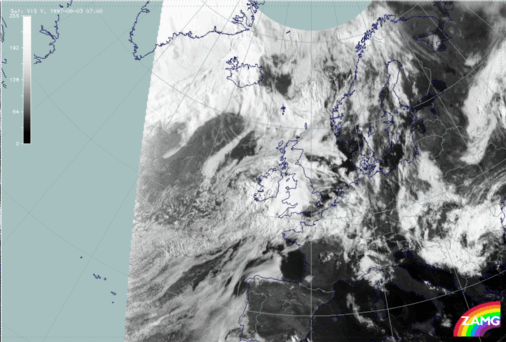
03 August 1997/06.00 UTC - Meteosat VIS image
|
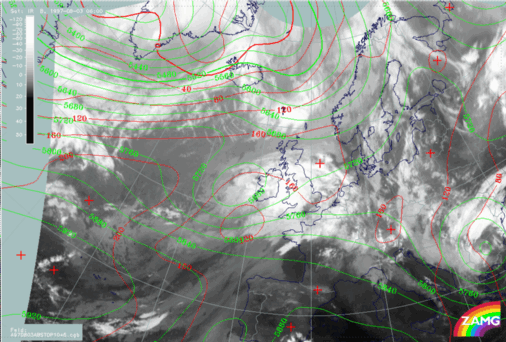
03 August 1997/06.00 UTC - Meteosat IR image; red: height contours 1000 hPa, green: height contours 500 hPa
|
The intensive dry Black Stripe in the WV is now clearly to the south of the Upper Level Low spiral structure just mentioned; it moved to south Ireland and is connected with the intensified cloud area east of Ireland and a newly developed cellular cloud area over Ireland. This is a new aspect during this case study which could be recognised only now: the encouplement of the spiral feature of the Upper Level Low and the Dark Stripe at the rear of the frontal cloud bands might be an additional factor for an imminent Rapid Cyclogenesis.


