02 - 03 AUGUST 1997 - KEY PARAMETERS ON ISOBARIC SURFACES FOR 03 AUGUST 00.00 UTC
by ZAMG
|
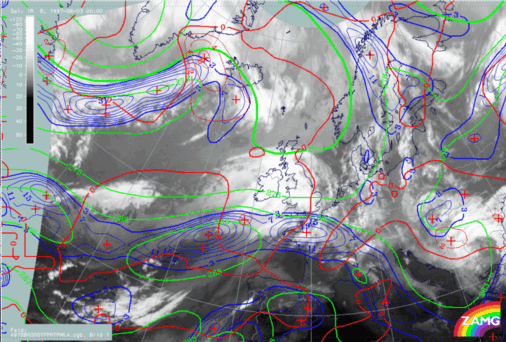
03 August 1997/00.00 UTC - Meteosat IR image; blue: thermal front parameter (TFP) 500/850 hPa, green: equivalent thickness 500/850
hPa, red: temparature advection - WA 1000 hPa
|
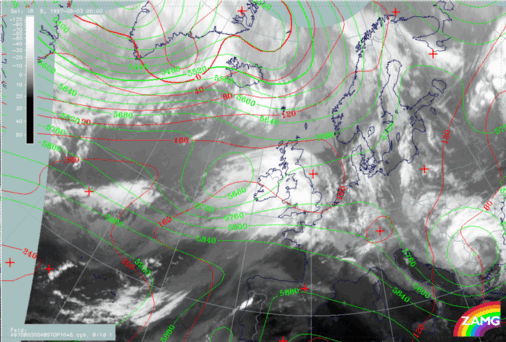
03 August 1997/00.00 UTC - Meteosat IR image; red: height contours 1000 hPa, green: height contours 500 hPa
|
|
|
|
|
|
|
|
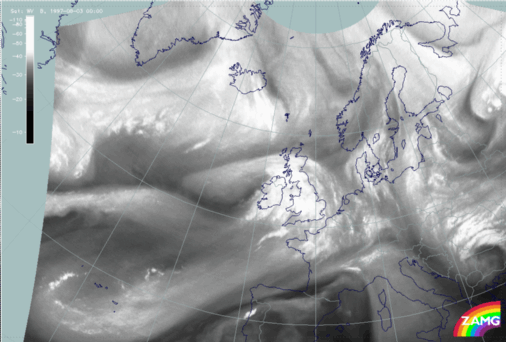
03 August 1997/00.00 UTC - Meteosat WV image
|
|
Numerical model fields relevant for the frontal situation (left image top) as well as for the Upper Level Low situation (right image top) complete the conceptual model diagnosis. The frontal situation (left image top) is unchanged since the beginning of this case study: a west - east oriented thickness gradient very similar to an air mass boundary and a well-developed TFP accompany the southern edge of the cloud bands. WA is still very weak and is in some contradiction to the well-developed cloud shield.
In contrary to this, distinct developments have taken place in the upper level height field (right image): the tie-off stage of a cut-off process has now been reached. The closed Upper Level Low circulation is in good agreement with the WV features (left image bottom). The surface (1000 hPa) height field does not show any distinct features of a low there.
|
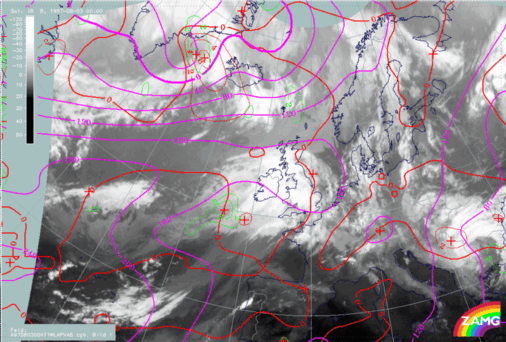
03 August 1997/00.00 UTC - Meteosat IR image; magenta: height contours 1000 hPa, green: positive vorticity advection (PVA) 500 hPa,
red: temparature advection - WA 1000 hPa
|
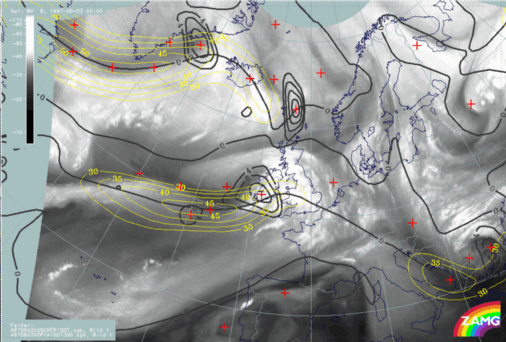
03 August 1997/00.00 UTC - Meteosat IR image; yellow: isotachs 300 hPa, black: shear vorticity 300 hPa
|
|
|
|
Both images above contain the numerical model parameters relevant for Rapid Cyclogenesis. As before, the Wave situation (left image) is demonstrated by the surface height, the WA and the PVA at 500 hPa; the jet situation (right image) is demonstrated by the isotachs, zeroline of shear vorticity and PVA at 300 hPa. The physical background has remained the same since the beginning of the case study. A weak Wave but a distinct jet situation can be noticed. As before there is a discrepancy between the model jet axis and the WV features.
03 August 1997/00.00 UTC - Meteosat WV image; cyan: positive vorticity advection (PVA) 500 hPa, green: height contours 500 hPa
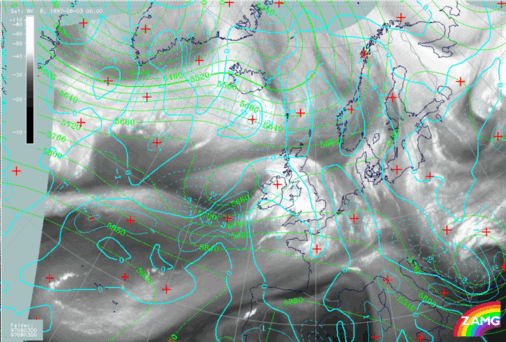
A fact which seems to become clearer at this point of time is that the upper level features dominate the cloud structures more and more. There is a pronounced PVA maximum at 300 hPa in the left exit region over Ireland, accompanied by an intensified cloud area. The image above shows the PVA fields at 500 hPa: the dominant maximum at this height is more to the south-west of both Ireland and the PVA maximum at 300 hPa. A comparison with the Upper Level Low height field clearly indicates that the PVA maximum at 500 hPa is connected to the curvature vorticity of the Upper Level Low and indicates the propagation of this low.
