19 FEBRUARY 1997 - RELATIVE STREAMS AND CONVEYOR BELTS FOR RAPID CYCLOGENESIS 06.00 UTC

by ZAMG


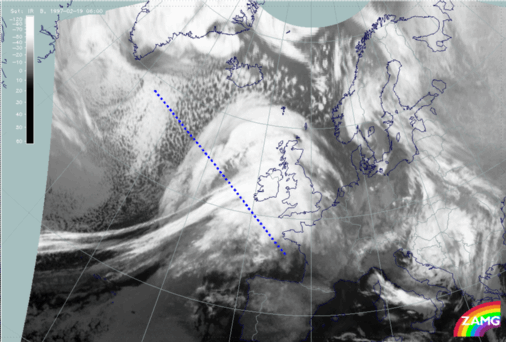
19 February 1997/06.00 UTC - Meteosat IR image; position of vertical cross section indicated
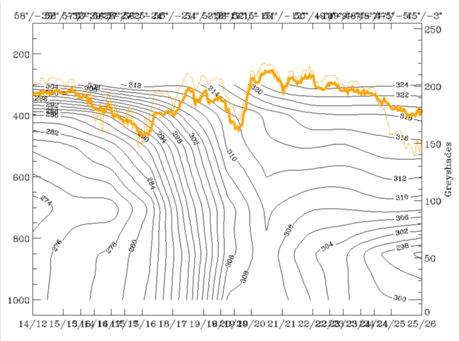
19 February 1997/06.00 UTC - Vertical cross section; black: isentropes (ThetaE), orange thin: IR pixel values, orange thick: WV pixel values
The right image shows again the vertical cross section which is perpendicular to the cloud shield of the Rapid Cyclogenesis and to the Cold Front band (compare left image). In the ideal case there are typical relative streams connected with a Rapid Cyclogenesis, with a different appearance on low and high isentropic surfaces. In this case the 290K surface represents a low surface close to the bottom of the frontal zone, while 310K is a high surface on the top of the frontal zone.
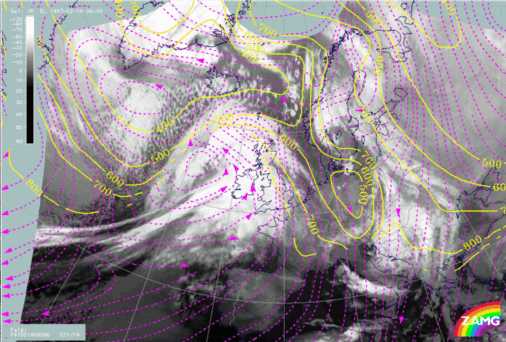
19 February 1997/06.00 UTC - Meteosat IR image; magenta: relative streams 290K - system velocity 231° 19 m/s, yellow: isobars
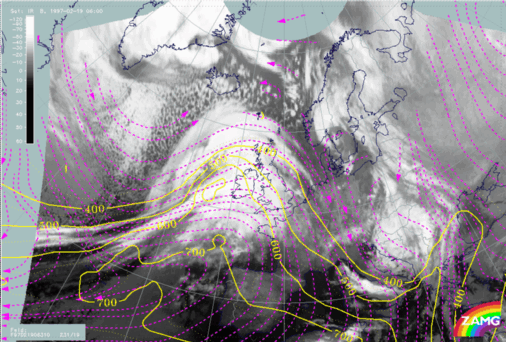
19 February 1997/06.00 UTC - Meteosat IR image; magenta: relative streams 310K - system velocity 231° 19 m/s, yellow: isobars
Relative streams on both surfaces can be seen in the left (290K) and right image (310K); indeed, they contain a lot of the typical features of an ideal case. On the low surface a splitting of a rising relative stream from south-south-east accompanies the cloud head of the Rapid Cyclogenesis, on the high surface a sinking relative stream from behind transports dry air across the cloud shield of the Comma to the area of the Rapid Cyclogenesis.

Summarizing, one can say that even in cases where a complicated structure with several conceptual models superimposed exists, an evaluation and estimation of all relevant key parameters helps to localize and separate the single conceptual models. This is the basis for a useful Very Short Range Forecast (compare Very Short Range Forecast).


SUB-MENU OF 19 FEBRUARY 1997
KEY PARAMETERS ON ISOBARIC SURFACES FOR RAPID CYCLOGENESIS 06.00 UTC
VERY SHORT RANGE FORECAST FOR THE FRONTAL SYSTEM