19 FEBRUARY 1997 - KEY PARAMETERS ON ISOBARIC SURFACES FOR 06.00 UTC
by ZAMG
|
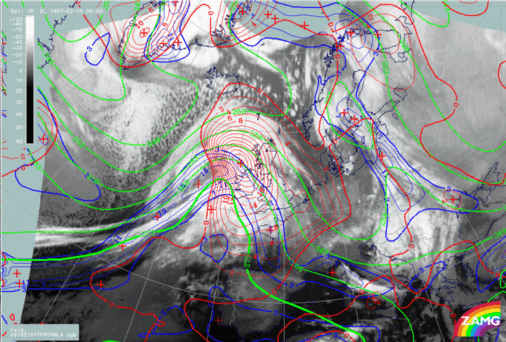
19 February 1997/06.00 UTC - Meteosat IR image; blue: thermal front parameter (TFP) 500/850 hPa, green: equivalent thickness 500/850 hPa,
red: temparature advection - WA 1000 hPa
|
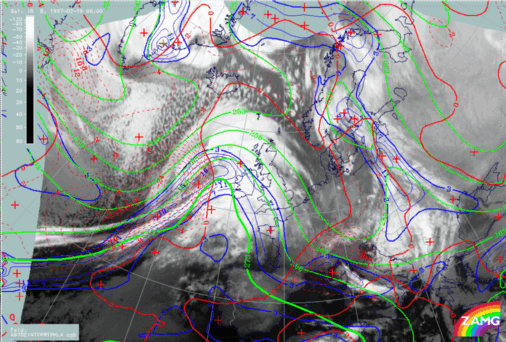
19 February 1997/06.00 UTC - Meteosat IR image; blue: thermal front parameter (TFP) 500/850 hPa, green: equivalent thickness 500/850 hPa,
red: temparature advection - CA 1000 hPa
|
|
|


