18 - 19 FEBRUARY 1996 - CLOUD FIBRE AT JET AXIS
by ZAMG
|
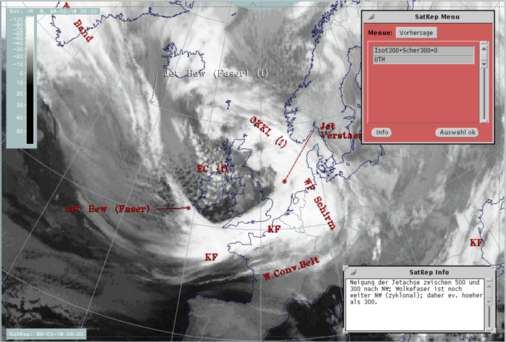
18 February 1996/06.00 UTC - Meteosat IR image; SatRep overlay: names of conceptual models; SatRep menu: key parameters for Jet Cloudiness
|
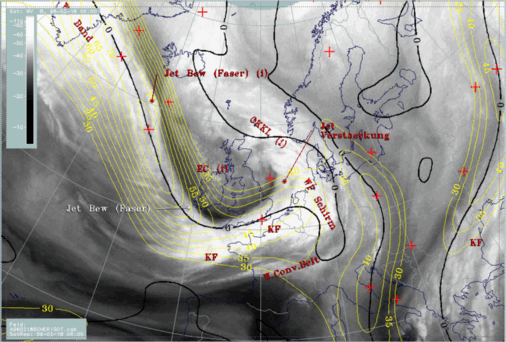
18 February 1996/06.00 UTC - Meteosat WV image; yellow: isotachs 300 hPa, black: shear vorticity 300 hPa
|
|
|
Consequently the key parameters from the conceptual model are contained in the following combination:
| Isot300 + Scher300=0 | This parameter combination shows the isotachs at 300 hPa greater than 30 units (m sec-1) and the zero line of shear vorticity at 300 hPa which marks the jet axis; one can get information about the existence and strength of jet streaks and the course of the jet axis |
|---|
Cloud fibres which form within a rising conveyor belt should appear, according to the conceptual model, immediately at the jet axis but reaching into the anticyclonic side; consequently a comparison between the location of the fibre and the zero lines of shear vorticity at different levels can give some information about the height level of the real jet core. In this example it should be higher than 300 hPa over the Atlantic, but very close to 300 hPa at the point where it crosses the Cold Front cloud band.


