Water Vapour Vortices - Key Parameters
by KNMI and FMI
- Potential Vorticity on an isentropic surface.
PV distribution shows a long narrow elongated zone of high PV values, associated with a Dark Stripe in the WV imagery. Local maxima occur in this elongated zone, connected to the cyclonic centre of the vortex. - Geopotential Height at 500/300 hPa
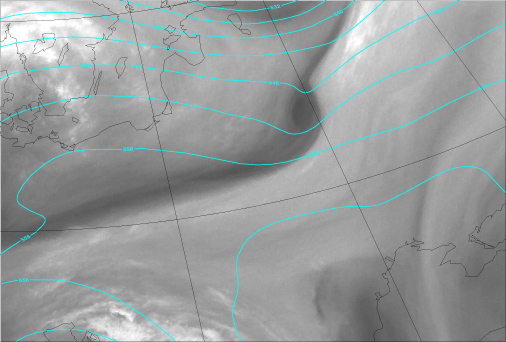
In the large scale geopotential height field a flow can often be seen which is non-zonal. The WV vortex is located in a region where a smaller trough is superimposed on the large scale trough. The geopotential height pattern at 500 hPa shows a small scale trough. At 300 hPa a small scale low can often be found with some enclosed contours. - Windspeed 300 hPa
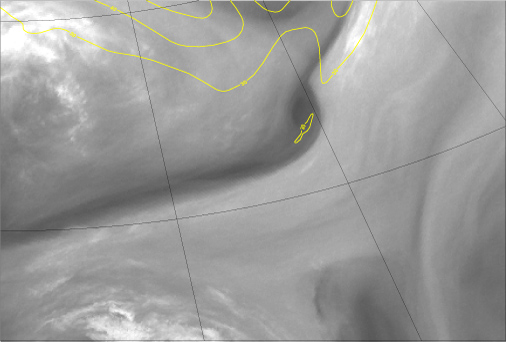
The WV Vortex is often located on the cyclonic side of a minor jetstreak, located on the southern (warm) side of the polar jet stream - Vorticity at 500/300 hPa
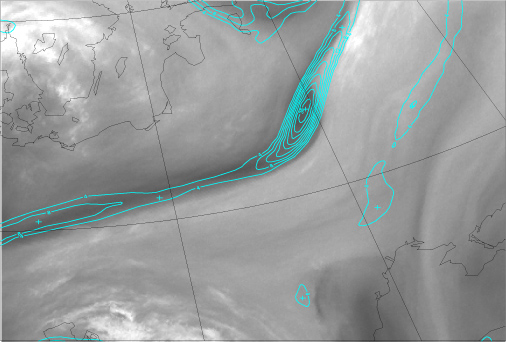
WV Vortex is accompanied by a distinct Relative Vorticity maximum at middle and upper troposphere. - Stretching Deformation
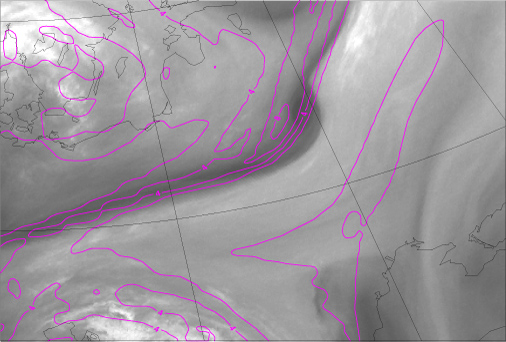
The WV vortex is often generated within an area of positive stretching deformation maximum.Potential Vorticity on an isentropic surface
13 January 2008/18.00 UTC - Meteosat WV 6.2 image; magenta: potential vorticity 315K
Geopotential Height at 500 and 300 hPa
13 January 2008/18.00 UTC - Meteosat WV 6.2 image; cyan: geopotential height 500 hPa
Windspeed 300 and 250 hPa
13 January 2008/18.00 UTC - Meteosat WV 6.2 image; yellow: isotachs 300 hPa
Vorticity at 500 and 300 hPa
13 January 2008/18.00 UTC - Meteosat WV 6.2 image; cyan: relative vorticity 500 hPa
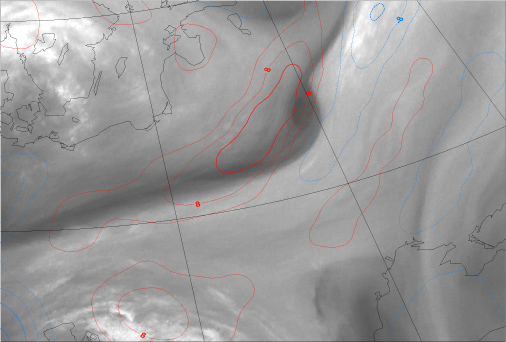
Stretching Deformation 500 and 300 hPa
13 January 2008/18.00 UTC - Meteosat WV 6.2 image; stretching deformation 500 hPa, red: positive, blue: negative