Warm Conveyor Belt - Cloud Structure In Satellite Images
by ZAMG
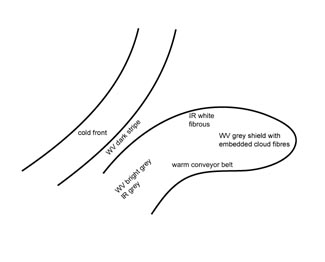
- In the satellite image the Warm Conveyor Belt looks like an anticyclonically curved cloud band usually in front of, but separated from, the cloud band of the Cold Front.
- In the IR and WV images the grey shades of the cloud band of the Warm Conveyor Belt vary from grey to white.
- The fibrous character dominates but there may be bigger areas of smooth high cirrus cloudiness.
- In the VIS image the cloudiness of the Warm Conveyor Belt is much less; if there is any appreciable cloudiness it consists of small single cells.
- As a consequence of the ascending Warm Conveyor Belt the grey shades in the IR image become continuously brighter from south to north or north-east, from there on decreasing again while it turns to south-east where it comes under the influence of sinking.
- During the life cycle some interactions between Warm Conveyor Belt and frontal cloud band can be observed:
- higher reaching cells may develop at the rear edge which is oriented to the approaching Cold Front;
- the anticyclonic part of the Warm Conveyor Belt may merge with the frontal cloudiness of the Cold Front;
- sometimes the southern boundary of Cold Front bands show superimposed high cloud patches.
|
13 September 2004/12.00 UTC - Meteosat 8 IR 10.8 image
|
13 September 2004/12.00 UTC - Meteosat 8 WV 6.2 image
|
|
|
|
|
|
13 September 2004/12.00 UTC - Meteosat 8 VIS 0.6 image
|
In the above example the Warm Conveyor Belt was clearly connected to the frontal system. An other example shows the Warm Conveyor Belt more isolated over northern Africa
01 July 2005/00.00 UTC - Meteosat 8 IR 10.8 image
01 July 2005/00.00 - Meteosat 8 RGB image (3.9, 6.2 and 7.3)