Upper Level Low - Cloud Structure In Satellite Images
by ZAMG and FMI
- Upper level trough
- Tear-off
- Cut-off
- Final stage
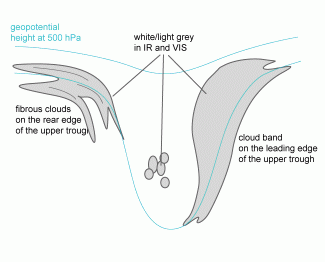
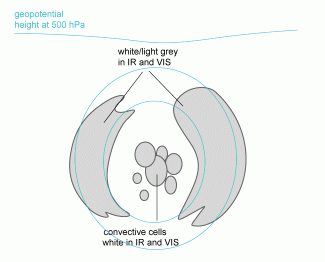
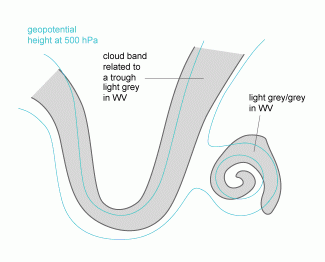
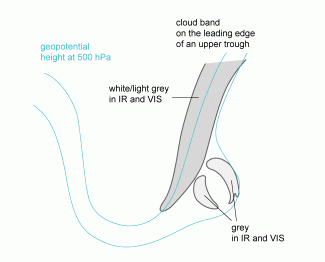
1. Upper level trough stage
There is a pronounced upper level trough behind a frontal zone.- In IR10.8 images white or light grey cloud band connected to the frontal zone on the leading side of the trough, some thin white cloud stripes due to Cloud Fibres on the rear side and possibly some convective white cells around the axis of the trough.
- In VIS0.6 images white or light grey cloud band connected to the front on the leading side of the trough and possibly some convective white cells around the axis of the trough.
- In WV6.2 images light grey bands on the leading and rear part of the trough.
|
|
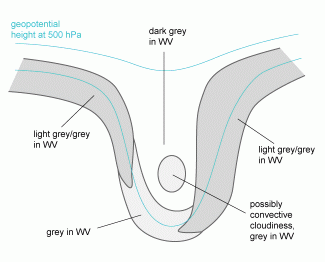
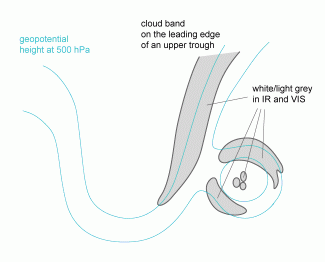
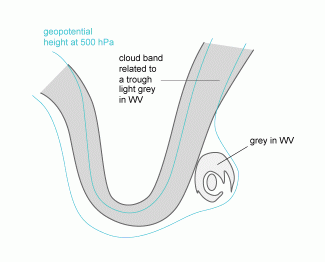
2. Tear-off
The bottom of the upper trough is detached from the main stream resulting in a closed circulation.- In IR10.8 images white to light grey cyclonically curved cloud band on the leading side of the trough, possibly also on the rear side. Some white convective shells may occur between the bands.
- In VIS0.6 images grey cyclonically curved cloud band on the leading side of the trough, possibly also on the rear side. Some white convective shells may occur between the bands.
- In WV6.2 images grey cyclonically curved cloud band around the detaching low.
|
|
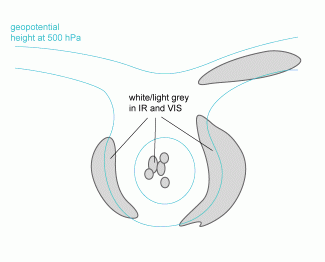
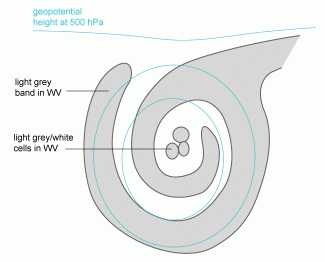
3. Cut-off stage
The Upper Level Low is separated from the main upper stream.- In IR10.8 and VIS0.6 images white to light grey cyclonically curved cloud bands on the leading and rear side of the low, later forming a spiral. Possibly some white convestive cells within it.
- In WV6.2 images round area or a spiral of grey, with some white cells on the leading side.
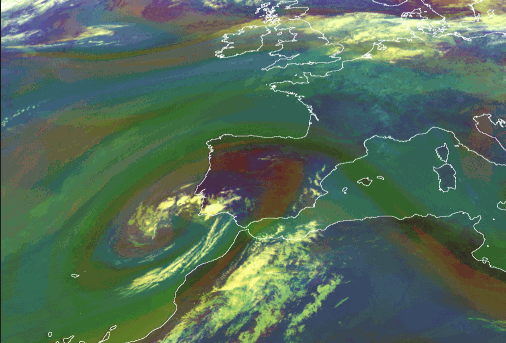
- In the WV6.2-WV7.3;IR9.7i-IR10.8i;WV6.2 combination ("airmass") the descending stratosperic air in the centre of the Upper Level Low appears dark red, and the cold pool appears bluish
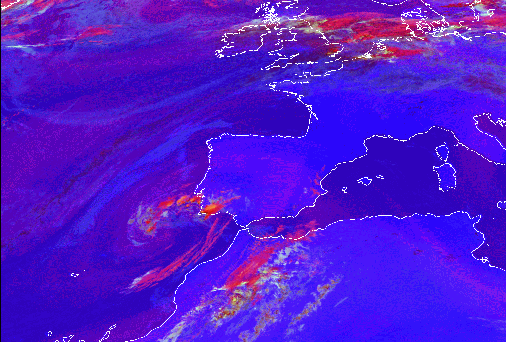
- In WV6.2-WV7.3;IR3.9i-IR10.8i;NIR1.6i-VIS0.6 combination ("convective storms") convective clouds appear red; strong, growing cells are yellow.
|
|
|
|
|
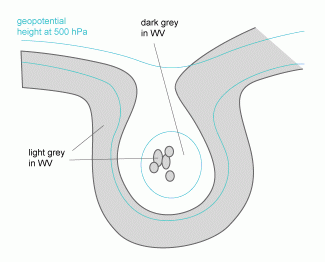
4. Final stage
The Upper Level Low merges with the main stream, or dissolves slowly while being almost stationary.- In IR10.8 and VIS0.6 images there are light grey cyclonically curved stripes that merge with a white cloud band of a frontal zone.
- In WV6.2 images there is a dark grey area that soon disappears under the light grey of the frontal zone.
|
1. The cloudiness belonging to the main stream is approaching
|
|
|
|
|
|
|
2. The ULL cloudiness merges with the frontal cloudiness
|
|
|
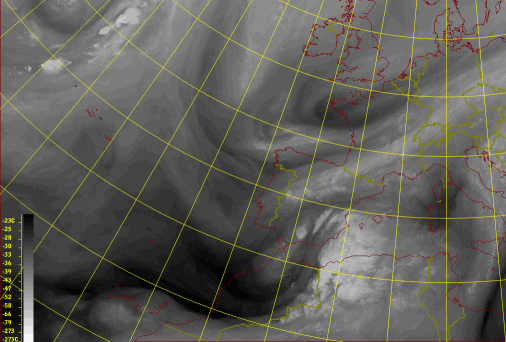
14 September 2005/06.00 UTC - Meteosat 8 IR 10.8 image
|
14 September 2005/06.00 UTC - Meteosat 8 WV 6.2 image
|
|
|
|
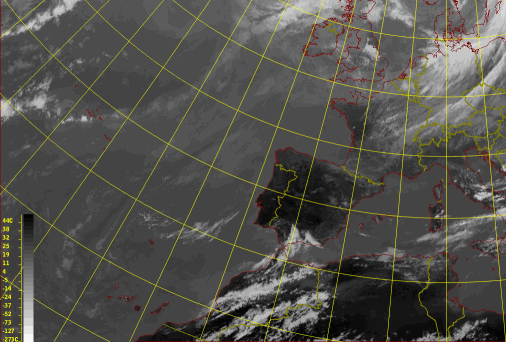
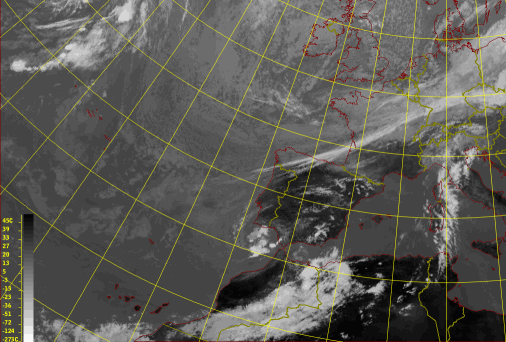
14 September 2005/12.00 UTC - Meteosat 8 IR 10.8 image
|
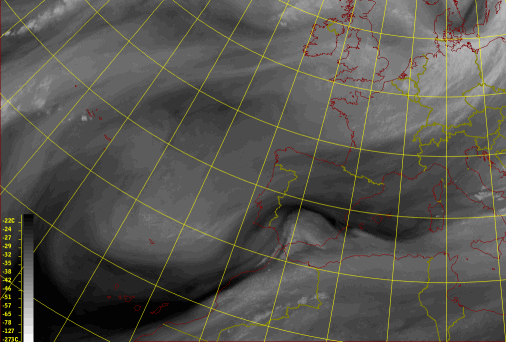
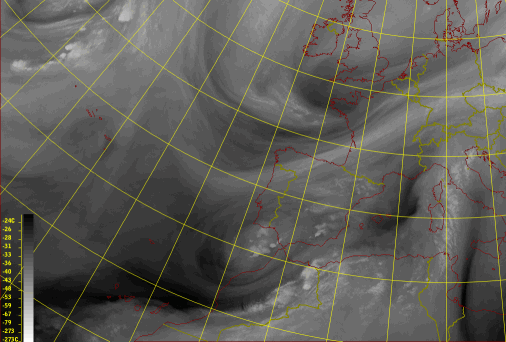
14 September 2005/12.00 UTC - Meteosat 8 WV 6.2 image
|
|
|
|
|
|
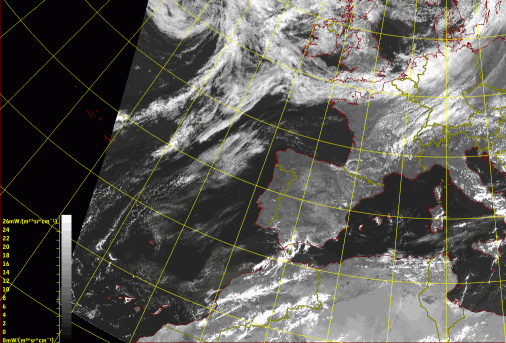
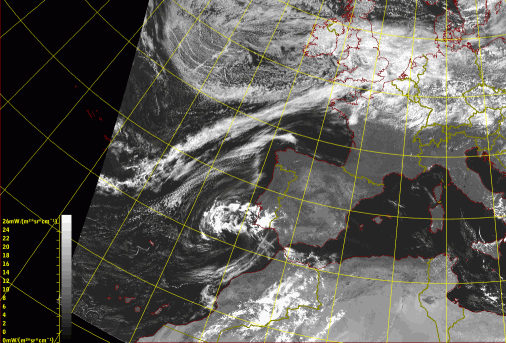
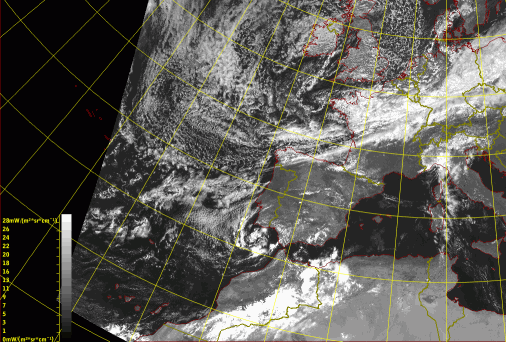
14 September 2005/12.00 UTC - Meteosat 8 HIRVIS image
|
|
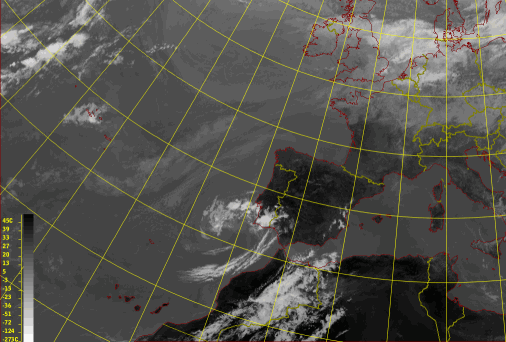
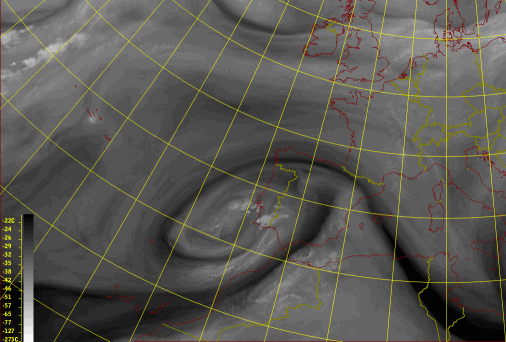
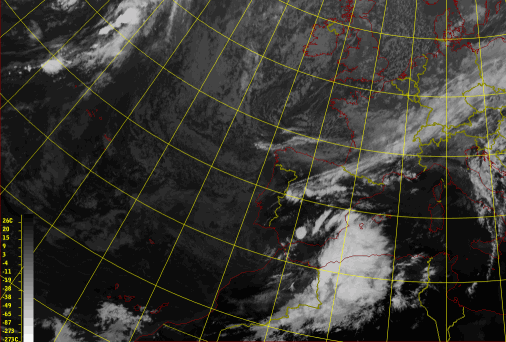
15 September 2005/12.00 UTC - Meteosat 8 IR 10.8 image
|
15 September 2005/12.00 UTC - Meteosat 8 WV 6.2 image
|
|
|
|
|
|
15 September 2005/12.00 UTC - Meteosat 8 HIRVIS image
|
|
|
|
|
15 September 2005/12.00 UTC - Meteosat 8 Airmass RGB image
|
15 September 2005/12.00 UTC - Meteosat 8 Convection RGB image
|
|
16 September 2005/12.00 UTC - Meteosat 8 IR 10.8 image
|
16 September 2005/12.00 UTC - Meteosat 8 WV 6.2 image
|
|
|
|
|
|
16 September 2005/12.00 UTC - Meteosat 8 HIRVIS image
|
|
16 September 2005/12.00 UTC - Meteosat 8 IR 10.8 image
|
16 September 2005/12.00 UTC - Meteosat 8 WV 6.2 image
|
|
|
Other conceptual models that may look like an Upper Level Low in satellite images are Comma (see Comma ) and Polar Low (see Polar Low ). These can be separated from each other with the help of numerical fields, especially on the 500 hPa level.

