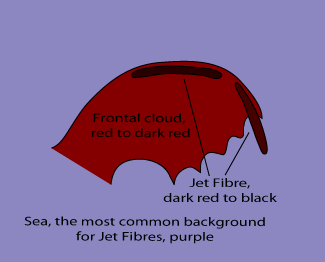
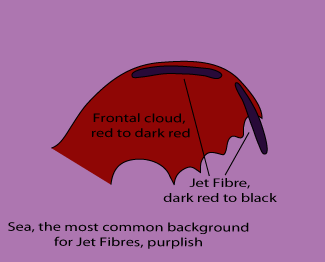
Jet Fibres - Cloud Structure In Satellite Images
by DHMZ
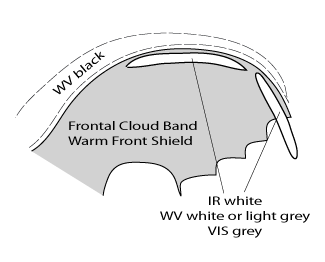
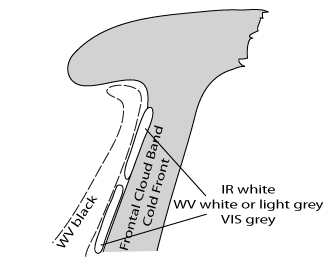
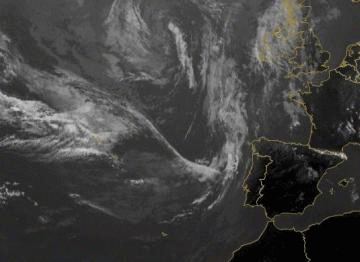
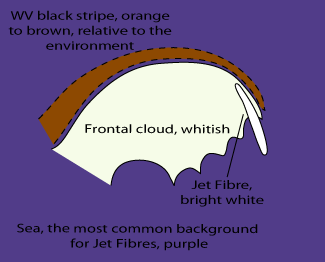
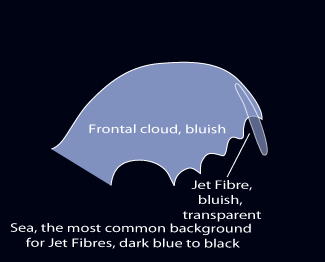
- They appear white (or very light grey) in both IR and WV images, with pronounced fibrous structure. In WV images they are almost always accompanied by black stripes on the cyclonic (left) side. In VIS images Jet Fibres are nearly transparent with colouring varying from light grey to grey. Although their colouring may be very similar to that of the surrounding clouds, their structure is very different, making them clearly recognisable. When a fibre appears above a lower-level cloud feature, the cloud texture is different, which makes the fibre distinct from the surroundings. VIS images sometimes reveal that the fibre casts a shadow on the cloud below or the Earth surface.
- Jet Fibres can appear wherever there are jets, but they are more easily recognisable above the sea then above the land because of the greater contrast they make with the sea surface.
- They are narrow with an order of magnitude of several tens of kilometres (usually a under hundred) but may be very elongated, with an order of magnitude from several hundreds up to couple of thousand kilometres.
- In most cases Jet Fibres persist for 8 to 12 hours, but in some cases they dissipate, the new ones developing with the whole process lasting for 24 hours or even longer.
|
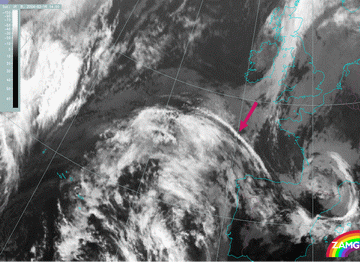
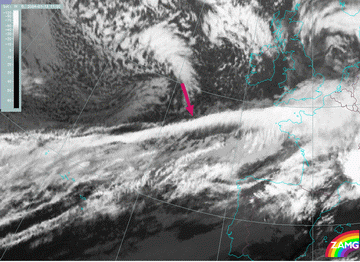
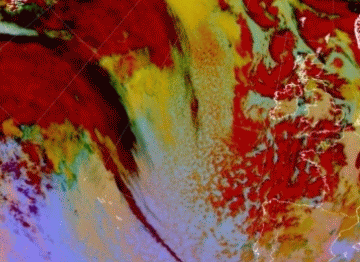
16 February 2004/14.00 UTC - Meteosat IR image
|
|
|
|
|
|
|
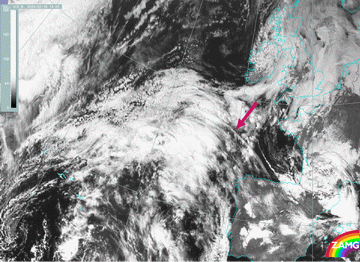
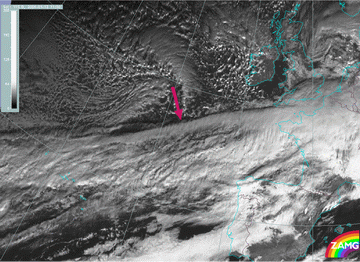
16 February 2004/14.00 UTC - Meteosat VIS image
|
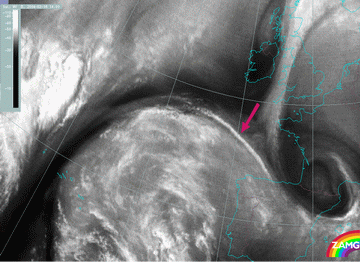
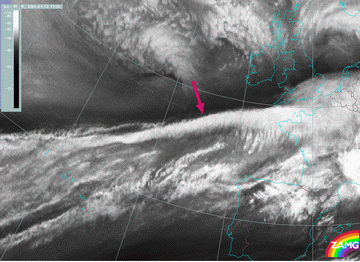
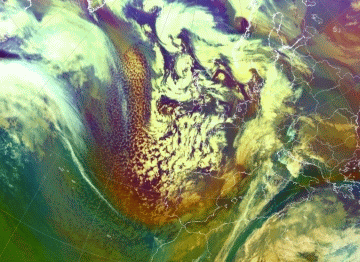
16 February 2004/14.00 UTC - Meteosat WV image
|
|
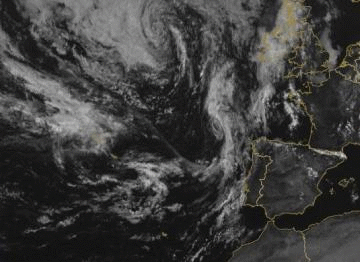
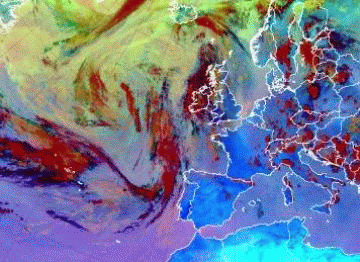
13 January 2004/11.00 UTC - Meteosat IR image
|
|
|
|
|
|
|
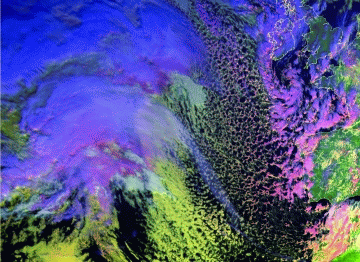
13 January 2004/11.00 UTC - Meteosat WV image
|
13 January 2004/11.00 UTC - Meteosat VIS image
|
There are also cases (images beneath) when Fibres appear at an angle to the Cold Front, or even perpendicular to it. That is the case when the Cold Front is a Kata type (see Cold Front ). To the rear of the frontal cloud band it can be seen from WV imagery that a jet axis lies approximately perpendicular to the frontal cloud band and jet fibres are located on the anticyclonic side of the WV black stripe. In the VIS image, the structure of Jet Fibres is different from the surrounding cloudiness, and narrow light grey stripe perpendicular to the frontal cloudiness can be recognised. In many of these cases there is an area of increased cloudiness within the frontal cloud band of the Cold Front (see Front Intensification by Jet Crossing ).
|
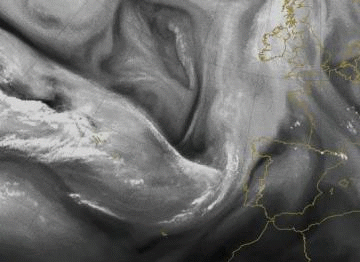
01 July 2009/12.00 UTC - Meteosat IR image
|
01 July 2009/12.00 UTC - Meteosat VIS image
|
|
|
|
|
|
01 July 2009/12.00 UTC - Meteosat WV image
|
Appearance in the Meteosat 8 HRVIS and RGB composite images
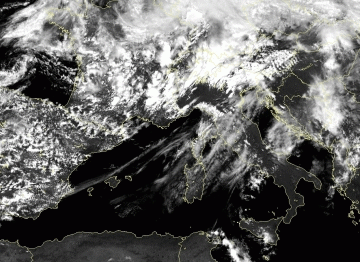
High resolution of Meteosat 8 HRVIS images can be highly beneficial for the recognition of fine-scale cloud features. It can be especially useful in this particular Conceptual model, for the distinction between a small-scale Jet Fibre and its parental Frontal system.In the following image fine structure of elongated and narrow grey high clouds over West Mediterranean extending from the Iberian peninsula to the Genoa bay, represent Jet Fibres, and they can be easily differentiated from the lighter broader frontal cloud band over Corsica, Sardinia and mid Italy.
Airmass RGB is an RGB composite based upon data from infrared and water vapour channels and can thus be used day and night. It is designed and tuned to monitor the evolution of cyclones, in particular rapid cyclogenesis, PV (potential vorticity) anomalies and jet streaks which enable us to notice jet fibres easily.
The Airmass RGB is combined of the WV6.2 - WV7.3 Brightness Temperature Difference (BTD) on red colour, the IR9.7 - IR10.8 BTD on green and the WV6.2 channel on blue. All three features are strongly related to air mass characteristics in cloud-free areas and to the height of the clouds in cloudy areas.
High clouds appear in white colour, mid-level clouds in light ochre and cloud-free areas in dark green (warm air mass with high tropopause) or blue (cold air mass with low tropopause). A particular feature of this RGB is that dry descending stratospheric air is marked by a reddish colour (link to the Airmass RGB key).
|
Jet Fibre as it appears in Airmass RGB images
|
20 January 2009/06.00 UTC - Meteosat 9 Airmass RGB image
|
|
|
The images beneath show the appearance of Jet Fibres in some other RGB composites, with different channel combinations.
|
Jet Fibre as it appears in RGB VIS0.6, NIR1.6, IR10.8i imagery
|
20 January 2009/12.00 UTC - Meteosat 8 RGB image VIS 0.6, NIR 1.6 and IR 10.8 inverted
|
|
|
This RGB nicely shows this particular cloud feature, but it is available only during daytime. For that fact, insight into some RGB available 24 hours is necessary.
The next one is so-called Dust RGB. This is a combination of IR channels and differences as follows: IR12.0-IR10.8, IR10.8-IR8.7, IR10.8. It helps to detect dust (evolution of dust storms over the desert), thin clouds and contrails. In this RGB combination thin high level ice clouds, such as Jet Fibres, appear black and can be distinguished from thick clouds which appear red (link to the Dust RGB key).
|
Jet Fibre as it appears in Dust RGB images
|
20 January 2009/06.00 UTC - Meteosat 9 Dust RGB
|
|
|
|
Jet Fibre as it appears in Microphysics RGB images
|
01 July 2009/12.00 UTC - Meteosat 9 Microphysics RGB
|
|
|

