Convective Cloud Features In Typical Synoptic Environments: At The Leading Edge Of Frontal Cloud Bands - Meteorological Physical Background
by ZAMG
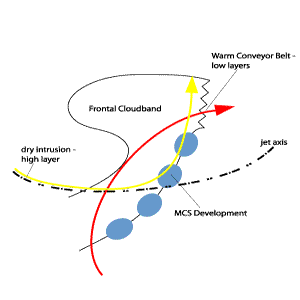
Such a situation develops when a jet streak crosses the front; dry air on the cyclonic side of the jet axis overruns the frontal cloud band and reaches its leading edge. Whilst the relative streams of the dry intrusion are sinking behind the frontal cloud band, they change to rising during the crossing of the front.
The troposphere under such conditions is characterized by (see Key Parameters):
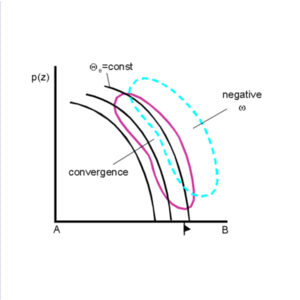
- frontal conditions indicated by TFP, a zone of high thickness gradients, a downward inclined gradient of isentropes, a frontal circulation created through convergence and upward vertical motion, etc.
- a rising warm conveyor belt in low to middle layers along the leading edge of the frontal cloud band
- a (rising) dry intrusion in middle to high layers along the same leading edge of the frontal cloud band
- the effect of both conveyor belts lying on top of each other leads to the unstable stratification of the troposphere
|
|
|
|
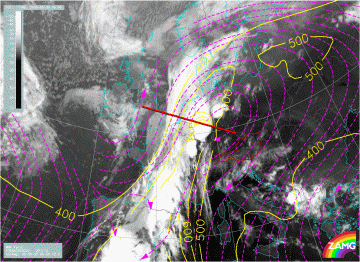
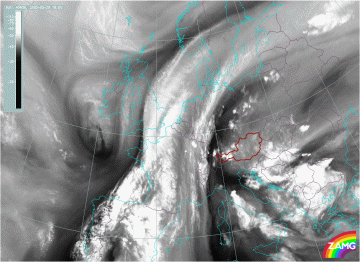
30 May 2005/00.00 UTC - Meteosat 8 IR10.8 image; blue: thermal front parameter 850 hPa, red: temperature advection 700 hPa
|
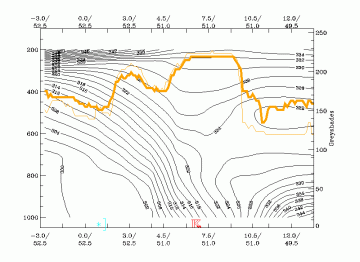
30 May 2005/00.00 UTC - Vertical cross section; black: isentropes (ThetaE), orange thin: IR pixel values, orange thick: WV pixel values
|

|
|
|
|
|
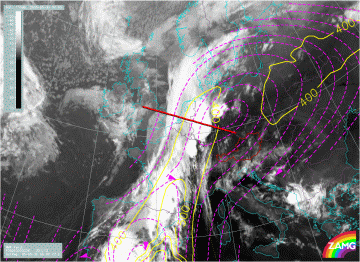
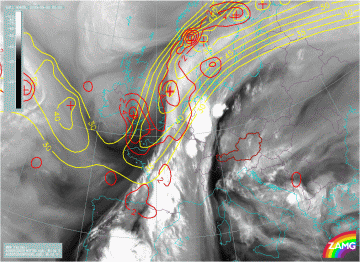
30 May 2005/00.00 UTC - Meteosat 8 IR10.8 image; magenta: relative streams 322K - system velocity: 221° 13 m/s, yellow: isobars 322K. Position of
cross section indicated
|
30 May 2005/00.00 UTC - Meteosat 8 IR10.8 image; magenta: relative streams 326K - system velocity: 221° 13 m/s, yellow: isobars 326K. Position
of cross section indicated.
|
|
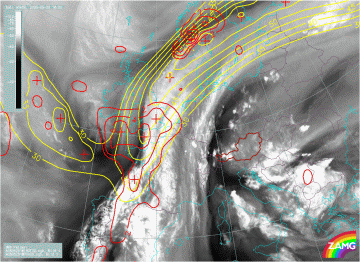
29 May 2005/18.00 UTC - Meteosat 8 WV6.2 image; yellow: isotachs 300 hPa, red: vorticity advection 300 hPa
|
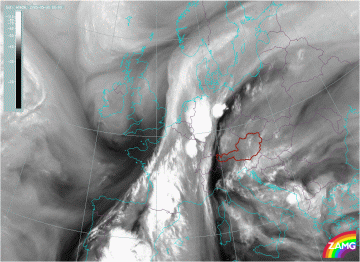
29 May 2005/18.00 UTC - Meteosat 8 WV6.2 image
|
|
|
|
|
|
30 May 2005/00.00 UTC - Meteosat 8 WV6.2 image; yellow: isotachs 300 hPa, red: vorticity advection 300 hPa
|
30 May 2005/00.00 UTC - Meteosat 8 WV6.2 image
|
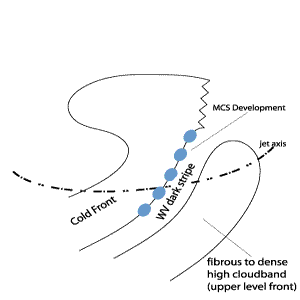
Six hours later, the MCSs within the area of the left exit can be found over Western part of Germany and the Elzas. Other MCSs have developed downstream above Southern France and in Southern Spain (Andalusia). The WV image again very clearly shows the jet axis (bottom right). The jet axis can still be found just south of Ireland with an extensive dark area over South-East England and Normandy. The cloud tops along the cyclonic side are continuously increasing downstream which can be explained by the supply of more humid air in upper levels. The surroundings of the MCS cloudiness are again characterized by this typical black (dry) area around of the cell (see Cloud structure in satellite images).
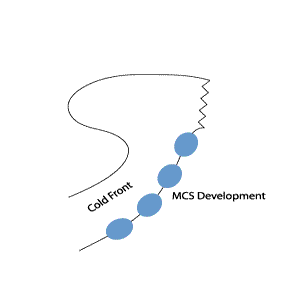
MCSs develop in connection with warm air, therefore they can be found in front of or within the leading parts of Cold Fronts. Convective systems which develop in different synoptic environments and are described in chapters Cumulonimbus Cluster, Enhanced Cumulus and Comma. (see Cumulonimbus Cluster , Enhanced Cumulus and Comma ).


