Warm Front Shield - Typical Appearance In Vertical Cross Sections
by ZAMG
The field of humidity shows high values immediately behind and within both frontal surfaces of the Warm Front. Lower values can be found below the higher gradient zones. Of special interest in this connection are the lower humidity values between the two frontal zones, indicating air masses of different origin.
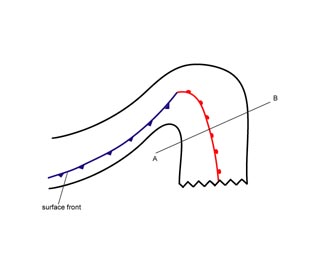
Like the distribution of humidity, the field of temperature advection can also be separated into two parts. WA exists above and within the crowding zone of the surface warm front. CA can be found below and ahead of the surface front. In contrast, the upper level front is completely within WA, with higher values of WA above and within, and lower values below, the higher gradient zone. The maximum of the WA can be found within the higher gradient zones of both frontal surfaces. In the case of the surface warm front the WA maximum is situated at approximately 800 hPa while in the case of the upper level front it can be found at approximately 600 hPa. These two maxima correspond to the two WA maxima in the isobaric fields, the main one in front of and the second one behind the TFP (see Key parameters).
All three channels of satellite images across the Warm Front Shield show a broad area of high values. In the ideal case typical distributions can be observed. While the IR image shows, across the Warm Front Shield, only weakly increasing values of grey shades from the rear to the leading edge, the distribution of the grey shades in the VIS image is inverse (see Cloud structure in satellite image). The most pronounced feature in the WV image is the minimum associated with the dry air at the leading edge of the shield.
The sharp decrease of IR and WV pixel values at the leading edge of the Warm Front Shield is associated with a jet streak, which can be found at approximately 300 hPa.
|
03 January 2005/12.00 UTC - Meteosat 8 IR 10.8 image; position of vertical cross section indicated
|
|
|
|
|
03 January 2005/12.00 UTC - Vertical cross section; black: isentropes (ThetaE), red thick: temperature advection
- WA, red thin: temperature advection - CA, orange thin: IR pixel values, orange thick: WV pixel values
|
|
|
|
|
03 January 2005/12.00 UTC - Vertical cross section; black: isentropes (ThetaE), blue: relative humidity, orange
thin: IR pixel values, orange thick: WV pixel values
|
|
|
|
|
03 January 2005/12.00 UTC - Vertical cross section; black: isentropes (ThetaE), yellow: isotachs, orange thin:
IR pixel values, orange thick: WV pixel values
|
|
|
|


