Warm Front Band - Typical Appearance In Vertical Cross Sections
by ZAMG
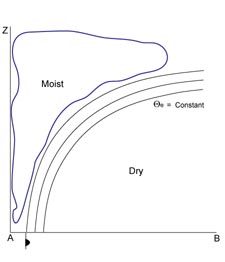
The field of humidity shows high values immediately behind and above the frontal surface of the Warm Front. Low values can be found below the gradient zone of the equivalent potential temperature.
Like the distribution of humidity, the field of temperature advection can also be separated into two parts. Therefore WA exists above and within the gradient zone of the Warm Front. The maximum of the WA can be found within the gradient zone in the mid-levels of the troposphere at approximately 500 hPa. On the other hand CA can be found below and in front of the gradient zone.
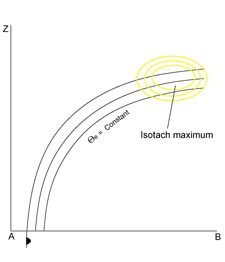
At the leading part above the frontal surface, at approximately 300 hPa, the atmosphere is characterized by a pronounced isotach maximum.
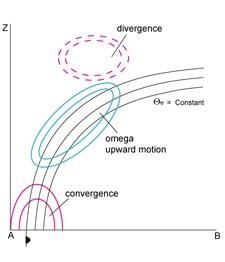
Well developed fronts are accompanied by a zone of distinct convergence within and divergence above the frontal zone. Consequently, upward vertical motion can be found above the frontal zone, responsible for cloud development.
The satellite images across the Warm Front are, in the ideal case, characterized by typical distributions. While across the frontal area the IR image shows continuously increasing values of grey shades from the rear to the leading edge, the distribution of grey shades in the VIS image is reversed (see Cloud structure in satellite image). In contrast, the WV image shows high pixel values within the frontal cloudiness and a pronounced minimum associated with the dry air.
|
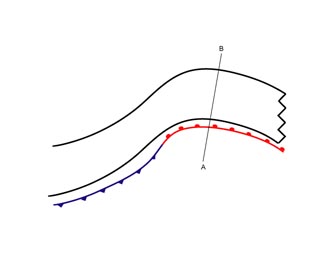
14 November 2004/00.00 UTC - Meteosat 8 IR 10.8 image; position of vertical cross section indicated
|
|
|
|
|
14 November 2004/00.00 UTC - Vertical cross section; black: isentropes (ThetaE), red thick: temperature advection
- WA, red thin: temperature advection - CA, orange thin: IR pixel values, orange thick: WV pixel values
|
|

|
|
|
14 November 2004/00.00 UTC - Vertical cross section; black: isentropes (ThetaE), blue: relative humidity, orange
thin: IR pixel values, orange thick: WV pixel values
|
|
|
|
|
14 November 2004/00.00 UTC - Vertical cross section; magenta thin: divergence, magenta thick: convergence, cyan
thick: vertical motion (omega) - upward motion, cyan thin: vertical motion (omega) - downward motion, orange
thin: IR pixel values, orange thick: WV pixel values
|
|
|
|
|
14 November 2004/00.00 UTC - Vertical cross section; black: isentropes (ThetaE), yellow: isotachs, orange thin:
IR pixel values, orange thick: WV pixel values
|
|
|
|


