Wave - Special Investigation: Waves with Double Structure
by ZAMG
Appearance in satellite images
In addition to the Waves described in this CM which show an increasing cloud bulge at the rear of frontal cloud bands, there is a sub-group of Waves which show a double structure of Wave configurations with the brighter cloud tops in the leading (usually more eastern) Wave feature and lower cloud tops and even dissipation in the rearward (usually more western) Wave feature; at the end of the process cloud upstream from the main cloud bulge has largely disappeared. In WV images there is a clear indication that upper level processes are involved. In this manual, this subtype is called "Double Structure Wave". Such situations occur quite often; the presentation below is based on an investigation of four cases of "Double Structure Waves".It should be noted that a third type of Wave ("Upper Wave") is described in this manual (see Upper Wave ). Whether all three are different types of Waves or wether they are connected still has to be determined.
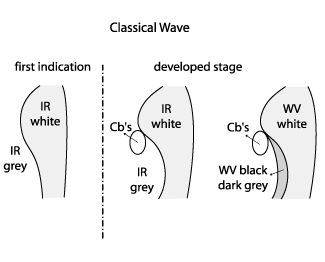
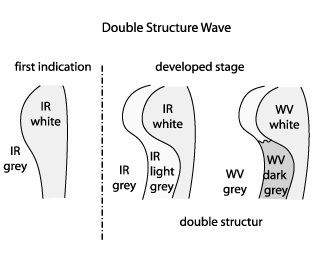
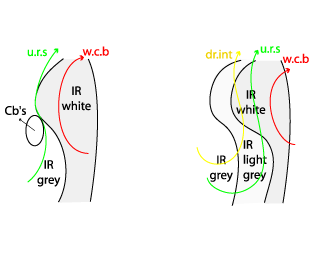
The two diagrams below show a simplified development of classical and Double Structure Waves.
|
|
In the case of a "Double Structure Wave" two approximately parallel Wave bulges develop early in the development. During the development a Dark Stripe (in WV) overruns the rear part of the double structure leading to a further lowering of cloud tops in that region. Consequently, there mat be quite an abrupt dissipation of the rearward Wave cloud.
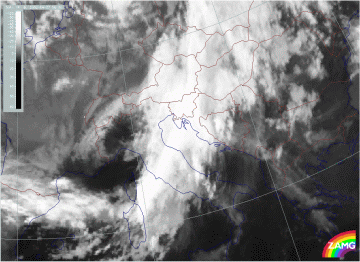
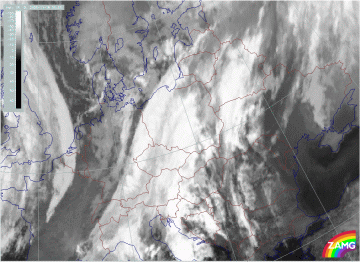
The 6-hourly loops below left show IR and WV images of a classical Wave, those on the right a "Double Structure Wave". The classical Wave images also show the development of Cb clouds over mid Italy moving into the northern Adriatic Sea. This cloud phenomenon should not be confused with the increasing Wave bulge which moves from Austria southeastwards to Slovenia and Croatia.
|
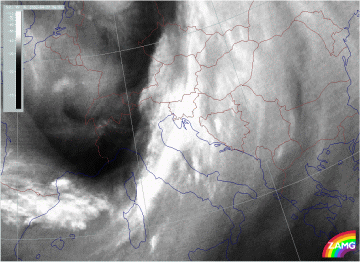
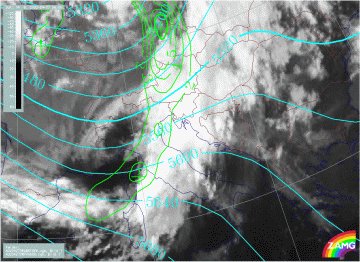
27 April 2002/06.00 UTC - Meteosat IR image; Classical Wave
|
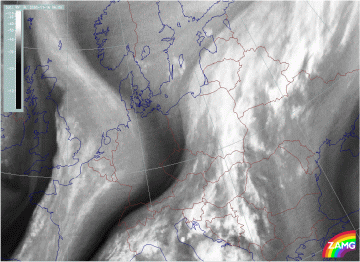
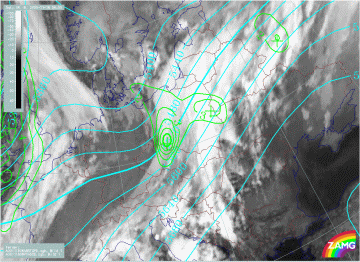
16 November 2000/00.00 UTC - Meteosat IR image; Double Structure Wave
|
|
|
|
|
|
27 April 2002/06.00 UTC - Meteosat WV image; Classical Wave
|
16 November 2000/06.00 UTC - Meteosat WV image; Double Structure Wave
|
Meteorological Physical Background
WV imagery strongly shows the involvement of the upper relative stream and the dry intrusion in the "Double Structure Wave".The following diagrams, derived from several cases, show the typical distribution of conveyor belts and the difference between the two Wave types.
The two images below demonstrate these findings. There is an extended Warm Conveyor Belt in the main part of the Wave bulge whilst in the second case the Warm Conveyor Belt is far in front of the "Double Structure Wave". There is an upper relative stream and a dry intrusion overrunning the more westerly Wave cloud.
|
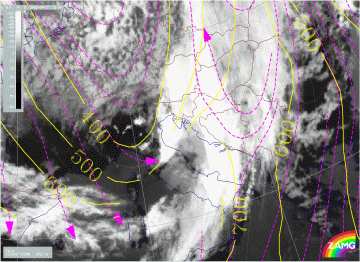
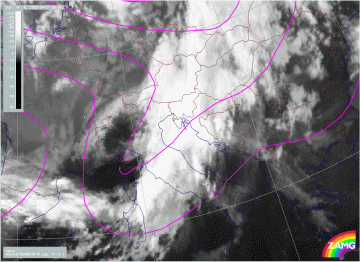
27 April 2002/12.00 UTC - Meteosat IR image; yellow: isobars, magenta: relative streams 308K - system velocity: 262° 10 m/s
|
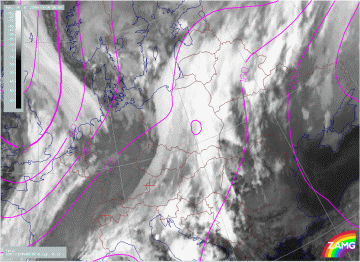
16 November 2000/06.00 UTC - Meteosat IR image; yellow: isobars, magenta: relative streams 314K - system velocity: 244° 15 m/s
|
|
|
Key Parameters
Surface Low
As the diagram below shows, the surface low is close to the point of inflection of the "S" - shaped rearward cloud boundary of the classical Wave (left). This is also true for the "Double Structure Wave" (right) but the low is associated with the leading Wave configuration.
Upper level trough and PVA max
In the case of a classical Wave (left) the upper level trough lies some distance from the cloud feature resulting in the PVA max lying mainly at the rear of the Wave bulge. In the case of a "Double Structure Wave" the upper level trough line is very close to the rearward Wave resulting in the PVA max being situated more above the cloud of this Wave.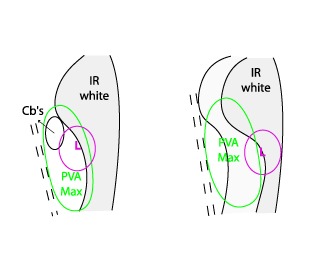
|
27 April 2002/06.00 UTC - Meteosat IR image; magenta: height contours 1000 hPa
|
16 November 2000/06.00 UTC - Meteosat IR image; magenta: height contours 1000 hPa
|
|
|
|
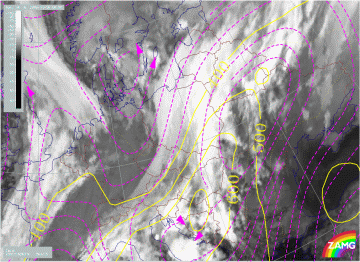
27 April 2002/06.00 UTC - Meteosat IR image; cyan: height contours 500 hPa; green: positive vorticity advection 500 hPa
|
16 November 2000/06.00 UTC - Meteosat IR image; cyan: height contours 500 hPa; green: positive vorticity advection 500 hPa
|
|
|
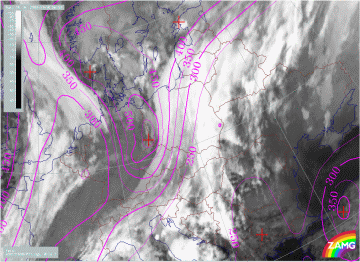
Height of PV (PV anomalies)
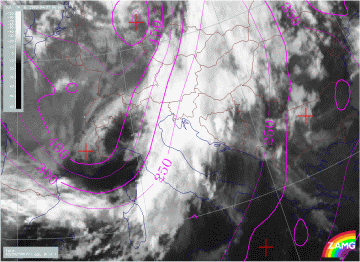
When looking at the field of potential vorticity (height of PV = 2 units), differences can be seen between the two types of Wave: In case of the classical Wave (left) the gradient of height of PV = 2 units is immediately behind the frontal cloud within the area of the WV Dark Stripe, in the case of the "Double Structure Wave" it lies above the rearward Wave. In both cases, the area of lowest height of stratospheric PV is behind the whole cloud system but much further away in case of the classical Wave. All cases investigated showed a good correspondence between the rearward edge of the cloud (leading system for the "Double Structure Wave") and the 300 hPa isolines.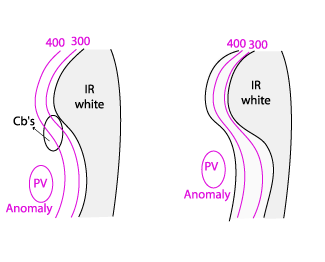
|
27 April 2002/06.00 UTC - Meteosat IR image; magenta: height of PV = 2 units
|
16 November 2000/06.00 UTC - Meteosat IR image; magenta: height of PV = 2 units
|
|
|
