Warm Conveyor Belt - Typical Appearance In Vertical Cross Sections
by ZAMG
The relative humidity shows in the area of the Warm Conveyor Belt high values of about 70% and higher.
The distribution of the temperature advection shows a maximum of warm advection within the Warm Conveyor Belt in the mid- and upper levels of the troposphere.
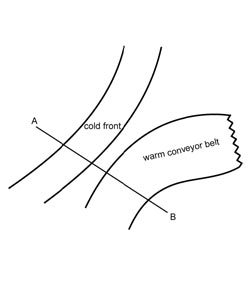
In the satellite image the Warm Conveyor Belt is characterized by high pixel values in the IR as well as in the WV image which indicates mid- and upper level cloudiness. Sometimes it is only possible with help of the vertical cross sections to distinguish between the high pixel values of the frontal system and those of the Warm Conveyor Belt in front of it.
|
13 September 2004/12.00 UTC - Vertical cross section; black: isentropes (ThetaE), blue: relative humidity, orange
thin: IR pixel values, orange thick: WV pixel values
|
|
|
|
|
13 September 2004/12.00 UTC - Vertical cross section; black: isentropes (ThetaE), red thick: temperature
advection - WA, red thin: temperature advection - CA, orange thin: IR pixel values, orange thick: WV pixel values
|
|
|
|
|
13 September 2004/12.00 UTC - Vertical cross section; black: isentropes (ThetaE), red thick: temperature
advection - WA, red thin: temperature advection - CA, orange thin: IR pixel values, orange thick: WV pixel values
|
|
|
|


