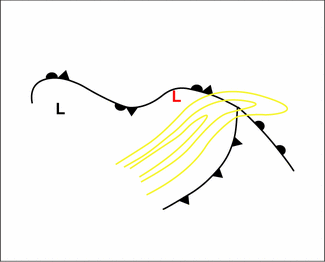
Secondary Low Centres In Occlusion Cloud Bands - Key Parameters
by FMI
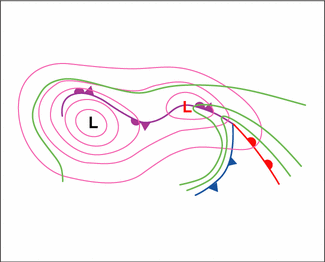
- Height contours at 1000 hPa:
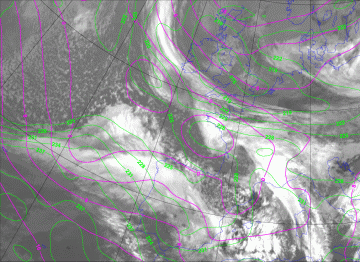
On the surface there is an elongated low pressure area connected to a long occluded front. The original low centre is separated from the occluded front, whereas the secondary centre develops within the frontal cloud band. - Equivalent thickness at 500-850 hPa:
There is the typical structure of an Occlusion, and usually the thermal structure of the Occlusion is neutral, see e.g. Occlusion: Warm Conveyor Belt Type (compare Occlusion: Warm Conveyor Belt Type ). In all types of Occlusions there is a thickness ridge along the occluded front. - Omega at 700 hPa:
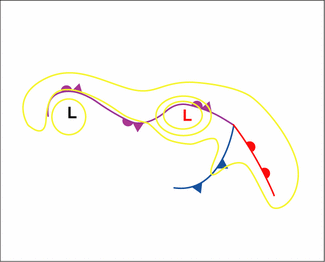
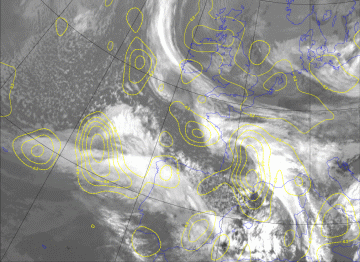
There is ascending motion related to the whole frontal system, but also a distinct maximum over the deepening Secondary Low. - 300 hPa Isotaches at 300 hPa:
The core of the jet stream crosses the occlusion point, and the strength of the jet streak is at least 50 m/s.
In the images below the Secondary Low is marked by a red arrow.
Height contours at 1000 hPa and equivalent thickness at 500 - 850 hPa
|
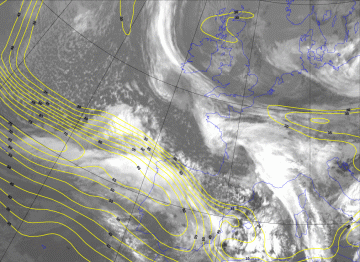
17 April 2008/12.00 UTC - Meteosat 9 IR image; magenta: height contours 1000 hPa, green: relative topography 500 - 850 hPa
|
|
|
|
Omega at 700 hPa
|
17 April 2008/12.00 UTC - Meteosat 9 IR image; yellow: omega
|
|
|
|
Isotachs at 300 hPa
|
17 April 2008/12.00 UTC - Meteosat 9 IR image; yellow: isotachs 300hPa
|
|
|
|


