Deformation Band - Cloud Structure In Satellite Images
by FMI
In satellite images Deformation Band is a cloud line which
- elongates, becoming narrower and longer, usually keeping its orientation
- thins out in the middle, eventually breaking
- can be straight or slightly arched
Deformation zones are generated by opposing flows, where cloud systems of two synoptic or meso-scale cloud systems are brought closer to each other. A deformation zone needs a cyclonic and an anticyclonic circulation to form. As anticyclonic circulations tend to be rather dry, characteristic patterns for deformation zones can be best seen in water vapour image loops. After the deformation stage the cloudiness dissipates or merges with other cloudiness.
The deforming band elongates in the direction of the upper level flow. Often there is sinking motion on the poleward side of the cloud band. This sinking air can be seen spreading in both directions with the upper level wind field.
Typical appearances for Deformation Bands in different channels:
- In VIS images grey, partly translucent fibres with well confined, even sharp, edges
- In IR images grey or white narrow, fibrous cloud band with well confined edges
- In WV images grey or white band, often with dark area on the poleward side
- In RGB combination images the Deformation Cloud Band can be distinguished from the background and nearby cloud systems more clearly than in the
single channel images:
- In WV6.2-WV7.3; IR9.7-IR10.8; WV6.2 combination the cloud band is seen white over a blue or green background. The sinking air polewards of the cloud band is seen as a reddish band.
|
|
|
18 February 2009/00.00 UTC - Meteosat 8 IR 10.8 image
|
18 February 2009/00.00 UTC - Meteosat 8 WV 6.2 image
|
|

|
|
|
|
18 February 2009/00.00 UTC - Meteosat 8 WV6.2-WV7.3/IR9.7-IR10.8/WV6.2 combination image
|
Appearance in AVHRR imagery
AVHRR images can be used to more accurately locate the Deformation Band, where upper level cirrus bands are best seen in the IR channels or a suitable combination image.|
15 June 2004/11.56 UTC - NOAA 0.8 µm image
|
15 June 2004/11.56 UTC - NOAA 11 µm image
|
|
|
|
|
|
15 June 2004/11.56 UTC - NOAA RGB image (0.6, 0.85 and 11 µm)
|
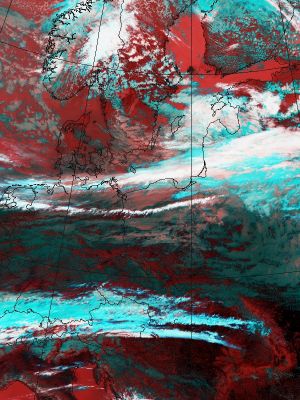
15 June 2004/11.56 UTC - NOAA RGB image (1.6, 11 and 12 µm)
|

