Comma - Key Parameters
by ZAMG and KNMI
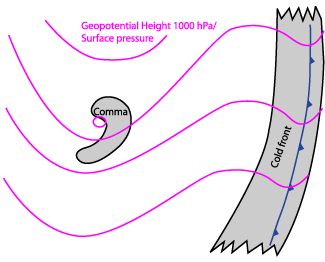
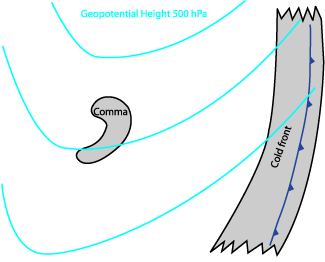
- Height Contours 500 and 1000 hPa:
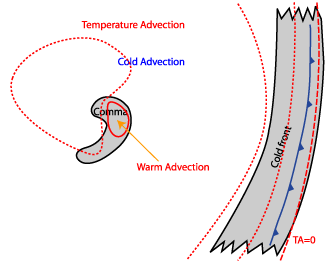
show a marked trough, sometimes even an isolated low. The Comma is situated at the leading edge of or near the trough line. Commas are situated at the cyclonic side of the polar jet. There may also be a left exit region of a jet streak (see below). - Temperature advection:
Since Commas are cold air features they are mainly situated in cold advection. Commas which are also partly in Warm Advection have higher baroclinic instability and show a higher probability for further development into Instant Occlusion and Cold Air Development (see Instant Occlusion and Cold Air Development ) - Instability indices:
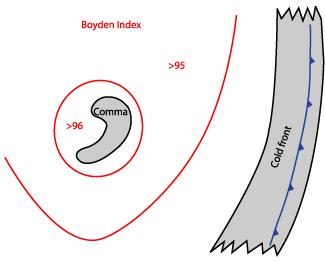
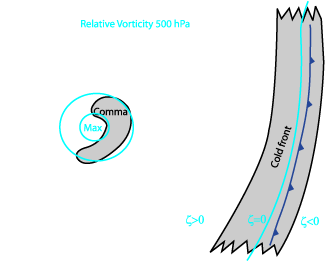
Commas are characterised by a rather unstable air mass. The typical range of the Showalter index with Commas is 0 to (max) 9, but mostly around 3. But strong instability is rarely seen in the Showalter field even though there can be heavy precipitation. The unstable air mass extends from the surface to about 800 - 700 hPa (see Typical appearance in vertical cross sections), a layer which is probably too low to be fully resolved by the Showalter index (which starts at 850 hPa). The Boyden index shows values that exceed 95. - Relative vorticity at 500 hPa:
is always positive, i.e. cyclonic. The maximum can be found to the rear of the cloud spiral. Both components (curvature and shear vorticity) are positive. Curvature vorticity dominates in the majority of cases, but shear vorticity is also important, especially at 300 hPa and if the Comma is situated in the left exit region of a jet streak (see further below). - PVA at 500 hPa:
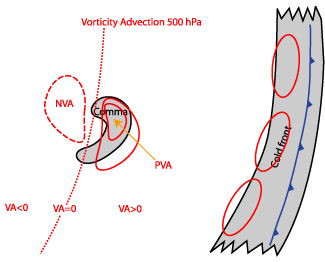
has its maximum above the Comma cloud or sometimes shifted to the south. At a level of 300 hPa the maximum is not so pronounced although absolute values are not smaller. There is also a correlation between the two levels: If there is no or only a weak maximum at 500 hPa the probability of a pronounced maximum at 300 hPa is quite small; a left exit region of a jet streak can lead to higher values at 300 hPa. - Isotachs at 300 hPa:
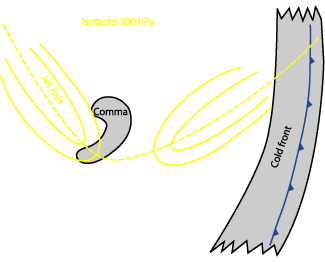
Cyclonic vorticity and PVA at 300 hPa can also be the reason for the position of a Comma in a left exit region of a jet streak. But, in these situations shear vorticity dominates curvature vorticity and the Comma spiral structures are rather weak. - Potential vorticity:
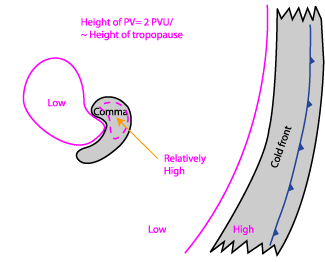
The height of PV=2 units shows a maximum to the rear of the cloud spiral which is equivalent to a lowering of the tropopause there to around 400 hPa. This is significantly lower than at the corresponding frontal cloud bands. Behind a Cold Front a low height of the PV can be observed in a rather large area parallel to the front, but for the Comma a characteristic maximum can be observed (lowest level in the troposphere).
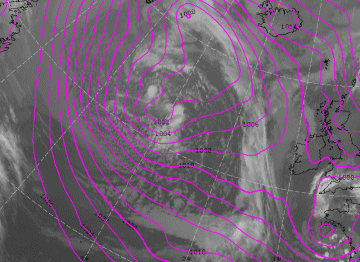
Height Contours 1000 hPa/Surface Pressure
|
25 April 2005/00.00 UTC - Meteosat 8 IR 10.8 image; magenta: height contours 1000 hPa
|
|
|
|
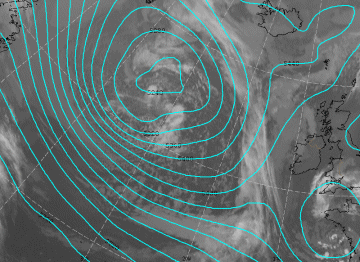
Height Contours 500 hPa/Surface Pressure
|
25 April 2005/00.00 UTC - Meteosat 8 IR 10.8 image; magenta: height contours 500 hPa
|
|
|
|
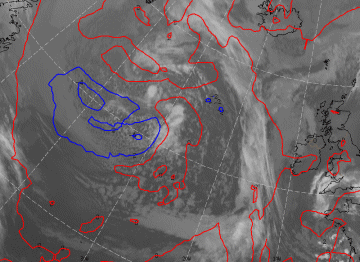
Temperature Advection
|
25 April 2005/00.00 UTC - Meteosat 8 IR 10.8 image; red: Temperature Advection 1000-500 hPa
|
|
|
|
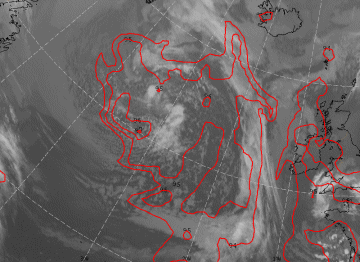
Boyden Index
|
25 April 2005/00.00 UTC - Meteosat 8 IR 10.8 image; red: Boyden Index
|
|
|
|
Relative Vorticity 500 hPa
|
24 April 2005/18.00 UTC - Meteosat 8 IR 10.8 image; cyan: relative vorticity 500 hPa
|
|
|

|
Positive Vorticity Advection 500 hPa
|
25 April 2005/00.00 UTC - Meteosat 8 IR 10.8 image; red: positive vorticity advection 500 hPa
|
|
|
|
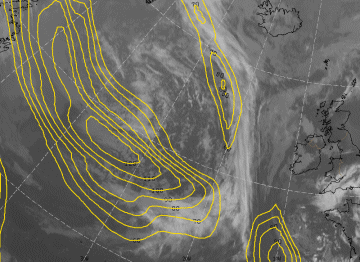
Isotachs 300 hPa
|
24 April 2005/18.00 UTC - Meteosat 8 IR 10.8 image; yellow: Isotachs 300 hPa
|
|
|
|
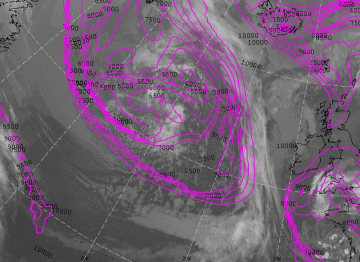
Height of PV=2 units/Height of tropopause
|
25 April 2005/00.00 UTC - Meteosat 8 IR 10.8 image; magenta: Height of PV=2 units.
|
|
|
|


